
Figures & data
Figure 1 Pictorial Dietary Assessment Tool (PDAT).
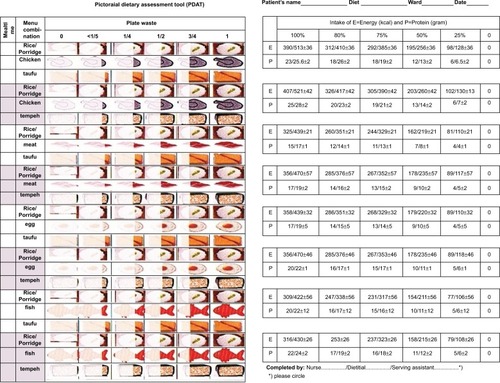
Table 1 Characteristics of health care staff and patients
Figure 2 Bland-Altman of the difference in energy intake (kcal) between PDAT and weighed food values.
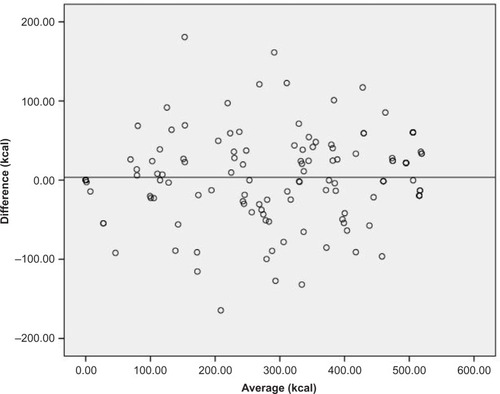
Figure 3 Bland-Altman of the difference in protein intake (g) between PDAT and weighed food values.
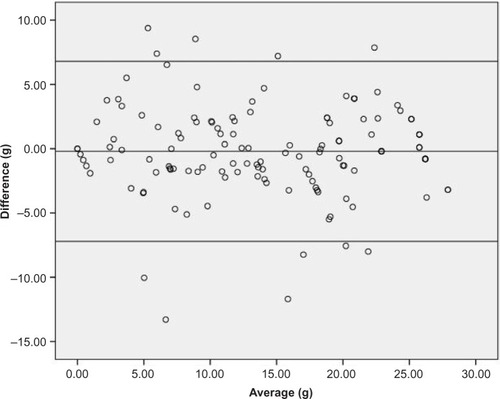
Figure 4 Bland-Altman of the difference in carbohydrate intake (g) between PDAT and weighed food values.
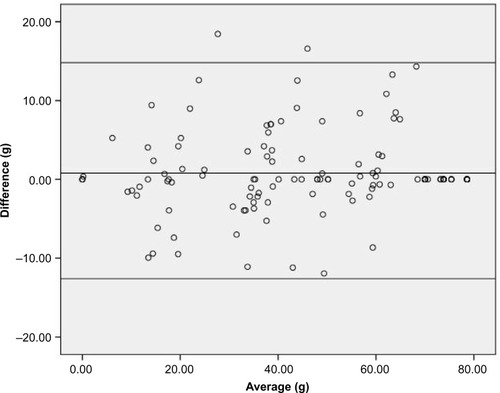
Figure 5 Bland-Altman of the difference in fat intake (g) between PDAT and weighed food values.
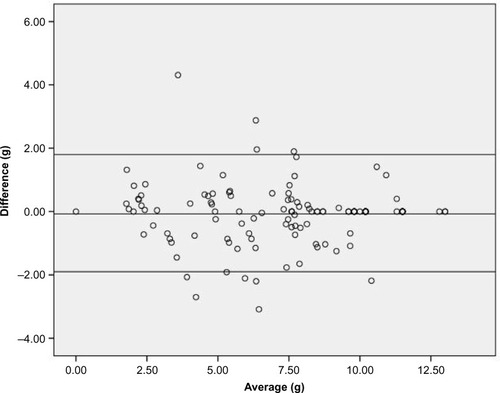
Table 2 Macronutrient intake estimated by the Pictorial Dietary Assessment Tool (PDAT) compared to food weighing (weighed)
Table 3 Accuracy of macronutrient intakes estimated by the PDAT in comparison with food weighing
Table 4 Health care staff estimates of percentage food consumed by patients compared to food weighing method
Table 5 Values of sensitivity and specificity of PDAT according to different levels of plate waste (food weighing)
Table 6 Inter-rater reliability analysis of estimated nutrient intake using PDAT among health care staff and comparison with food weighing