
Figures & data
Table 1 Construct validity hypotheses and results
Table 2 Responsiveness hypotheses and results
Table 3 Baseline characteristics
Figure 1 Distribution of prioritized occupations according to sex and occupational area assessed with the COPM.
Note: Occupational areas described by >70 participants are listed under each category.
Abbreviation: COPM, Canadian Occupational Performance Measure.
Abbreviation: COPM, Canadian Occupational Performance Measure.
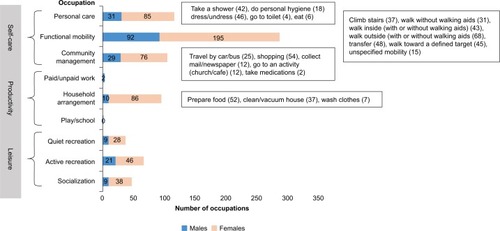
Table 4 The mean change scores (SD) for occupational performance and satisfaction with performance scored on a numerical rating scale (range 1–10), according to participants’ answers in the global rating scale of perceived change
Table 5 Various health care professionals self-perceived experience and competence when conducting the COPM baseline interview