Figures & data
Table 1 Baseline student demographics
Figure 1 Histogram depicting the differences in score between faculty graders.
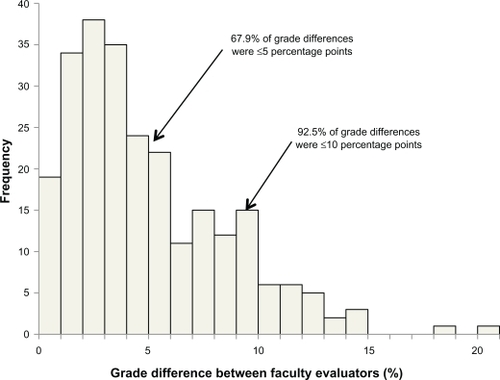
Table 2 Grade difference of faculty pairs stratified by differences in academic rank
Table 3 Correlation between student self-evaluation and faculty presentation scoresTable Footnotea (n = 252)
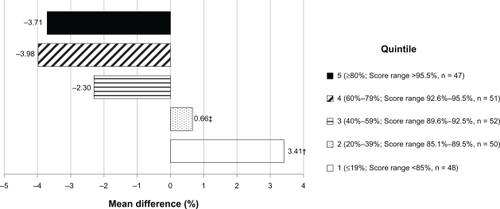
Figure 2 Differences between student self-evaluation and faculty presentation scores by quintile.a
Notes: aFaculty presentation score was the student’s final presentation grade (ie, average of faculty grader 1 and 2 scores). Statistical significance assessed by Dunnett’s T3 post hoc test. A negative value indicates that the student’s score was less than the mean faculty grader score and a positive value indicates that it was greater; †Differs from quintiles 3 (P = 0.001), 4 (P < 0.001), and 5 (P < 0.001); ‡Differs from quintiles 3 (P = 0.023), 4 (P < 0.001), and 5 (P < 0.001).