Figures & data
Figure 1 Change in mortality structure due to different reasons over the previous century in Japan.
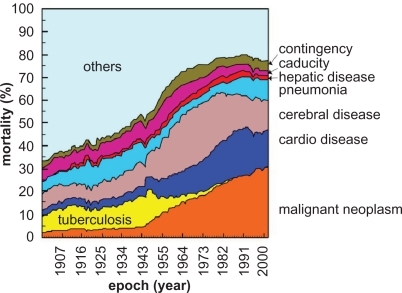
Figure 2 Daoyin gymnastic exercises depicting 44 persons in different postures on silk paper from more than 2000 years ago. Daoyin is a kind of stretching and relaxing gymnastics for health improvement and disease prevention.
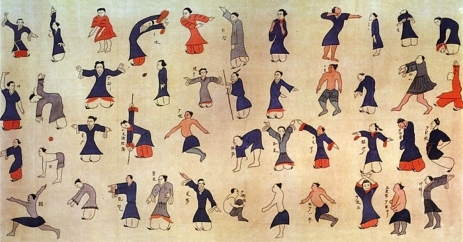
Figure 3 Profiles of daily HR, SBP, DBP, BT, and BW data collected from a couple ([a] wife, age 84 and [b] husband, age 85) over a 2-year period. Sporadic blanks indicate no measurement on those days. The bold solid lines are the polynomial approximation of SBP (9th order for [a] and 3rd order for [b]). Most data were measured in the afternoon.
![Figure 3 Profiles of daily HR, SBP, DBP, BT, and BW data collected from a couple ([a] wife, age 84 and [b] husband, age 85) over a 2-year period. Sporadic blanks indicate no measurement on those days. The bold solid lines are the polynomial approximation of SBP (9th order for [a] and 3rd order for [b]). Most data were measured in the afternoon.](/cms/asset/0e706af1-7746-487a-af8a-51cb5690441e/djmd_a_13126_f0003_c.jpg)
Figure 4 Similarity analysis of the monthly change in the SBP profile by the DTW method. A smaller value indicates a larger similarity with the reference profile. Monthly change in similarity is plotted clockwise from January 2001 to December 2002.
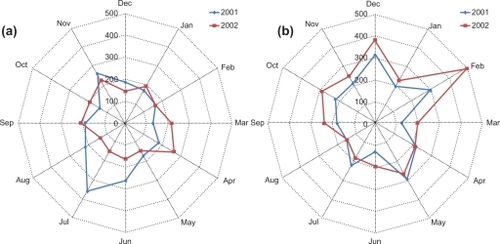
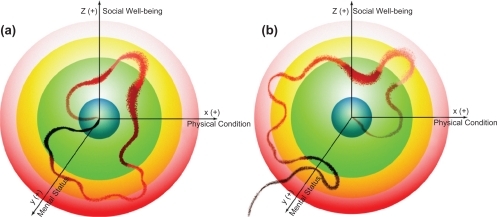
Figure 5 A 3D view in the phase space of health state. A lifelong course of health state dynamics, from birth to death crossing different zones, is illustrated. a) indicates a case in which life ceases because of the natural decrepitude. b) indicates a case in which the person succumbs to death due to the disease.