
Figures & data
Figure 1 PRISMA flow diagram.
Abbreviation: PRISMA, Preferred Reporting Items for Systematic Reviews and Meta-Analyses.
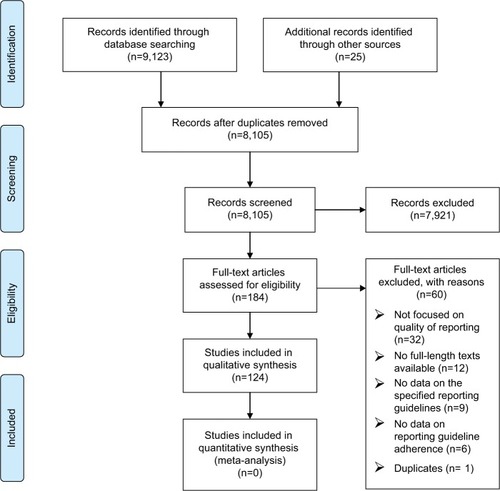
Table 1 Characteristics of the included studies
Table 2 Summary of the included studies’ conclusions
Table 3 Factors associated with reporting quality of articles using the CONSORT guideline
Table 4 Reporting quality of the 124 included systematic reviews, assessed by the modified AMSTAR/OQAQ (10 items, score out of 20)