Figures & data
Figure 1 Relationship of hemoglobin A1C (HbA1C) and incidence of diabetes complications.Citation4 In the United Kingdom Prospective Diabetes Study (UKPDS), each percentage point reduction in HbA1C was linked with substantial risk reductions in diabetes-related morbidity and mortality.
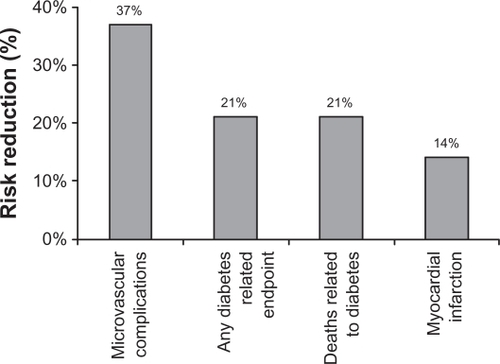
Table 1 Selected major evidence and rationale for intensive diabetes management
Table 2 Therapeutic goals for FPG, PPG, and HbA1C
Table 3 Differentiating available diabetes therapiesCitation14,Citation15,Citation23–Citation28
Table 4 Insulin initiation strategies
Figure 2 Approximate pharmacokinetic profiles of rapid- and long-acting insulin analogs as compared with an idealized profile of physiological insulin secretion.Citation44
Copyright © 2007 [Lippincott, Williams & Wilkins] Reprinted with permission from Boyle PJ, Zrebiec J. Management of diabetes-related hypoglycemia. South Med J. 2007;100(2):183–194.Citation44
![Figure 2 Approximate pharmacokinetic profiles of rapid- and long-acting insulin analogs as compared with an idealized profile of physiological insulin secretion.Citation44Copyright © 2007 [Lippincott, Williams & Wilkins] Reprinted with permission from Boyle PJ, Zrebiec J. Management of diabetes-related hypoglycemia. South Med J. 2007;100(2):183–194.Citation44](/cms/asset/6119e46c-4e94-4027-a5b4-0cac634a4c19/djmd_a_16451_f0002_b.jpg)
Table 5 Symptoms and management of hypoglycemia
Table 6 Reasons for patient referral to insulin therapy evaluation clinics
Table 7 Self-management and the chronic care modelCitation72