
Figures & data
Figure 1 Overview of study methodology and sampling framework.
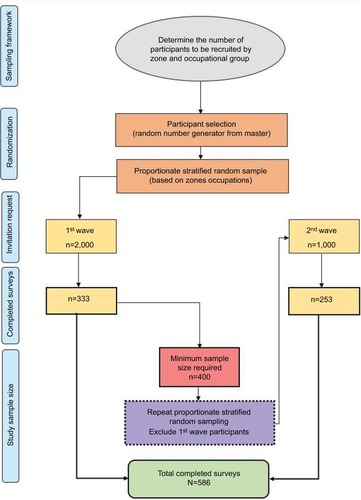
Figure 2 (A) Proportion of AHS staff members in different occupational groups. (B) Proportion of survey participants in different AHS occupational groups.
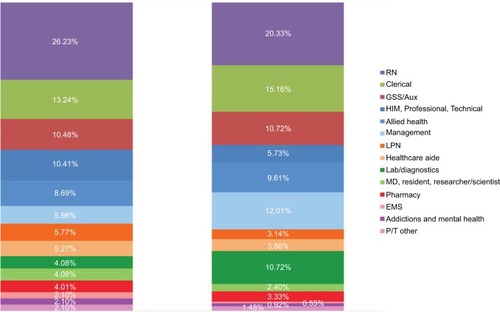
Table 1 Demographic information of participants who completed the survey (N=586)
Figure 3 Participant satisfaction with IT security (n=582).
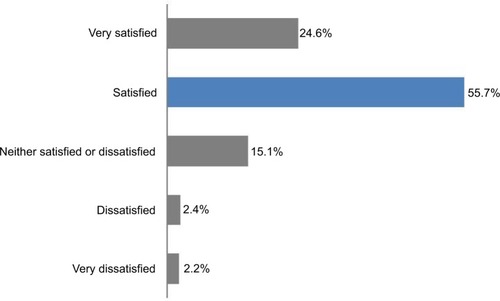
Figure 4 Participant perceptions of the two IT modules’ effectiveness (combined) (n=492).
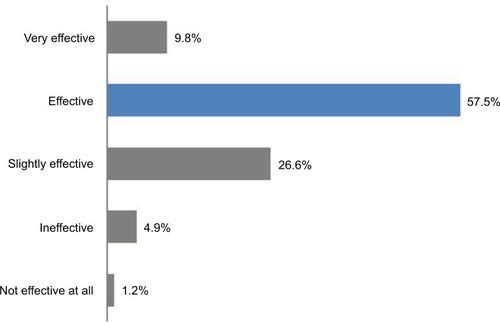
Table 2 Comparing the knowledge and staff satisfaction level with IT security between those who had completed Module I at the time of survey and those who had not completed the module
Table 3 Comparing the knowledge and staff satisfaction level with IT security between those who had completed Module II at the time of survey and those who had not completed the module
Table 4 Comparing the awareness level of IT security and privacy modules between clinical and non-clinical staff
Table 5 Comparing the awareness level of IT security and privacy modules between full-time and part-time staff members
Table 6 Logic regression of explanatory variables against the outcome “correct action upon receiving spam emails”