
Figures & data
Table 1 Allied health participants’ demographic data (N=126)
Table 2 Allied health participants’ ActiGraph (GT1M) PA data (N=126)
Figure 1 Bland–Altman plots examining the agreement of statistically significant intraclass correlation coefficient data assessed with the ActiGraph and self-report questionnaires (N=126).
Notes: unbroken line = mean difference; dashed line = coefficient of variability (±1.96×SD); x-axis = mean of respective variables; y-axis = mean difference between respective variables.
Abbreviations: AAS, Active Australia Survey; PA, physical activity; MVPA, moderate-to-vigorous physical activity; OSPAQ, Occupational Sitting and Physical Activity Questionnaire.
Abbreviations: AAS, Active Australia Survey; PA, physical activity; MVPA, moderate-to-vigorous physical activity; OSPAQ, Occupational Sitting and Physical Activity Questionnaire.
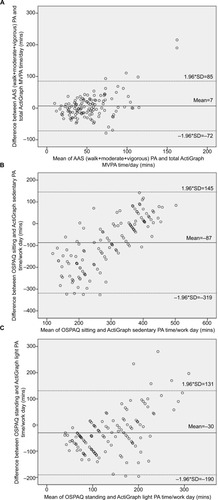
Table 3 Allied health participants’ summary of self-report PA questionnaires (N=126)
Table 4 Level of agreement between self-report PA questionnaires and ActiGraph PA measures (N=126)