Figures & data
Figure 1 Flowchart describing the stages of the study, the intervention is described by Stages II–V. The baseline Stage I is described elsewhere.Citation31.
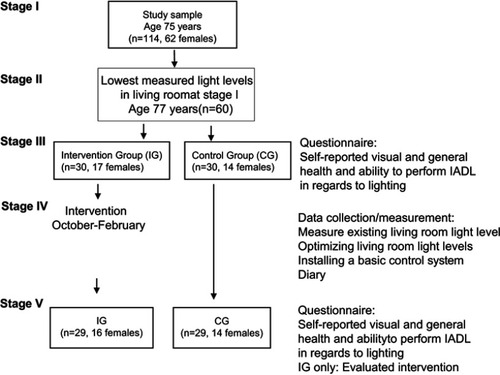
Table 1 Sociodemographic characteristics of the 77-year-old participants in the intervention and control group at Stage III and participants in the baseline study at Stage I
Table 2 Change in self-assessed VAS scores (mm) with regard to indoor lighting levels, IADLs and health between Stage V and Stage III
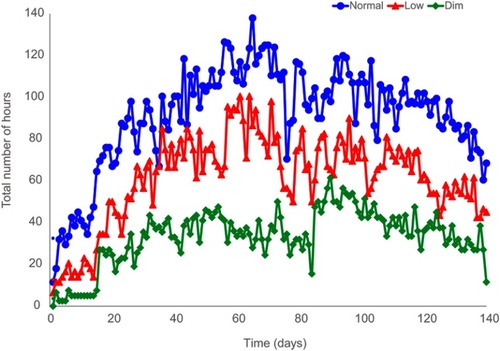
Figure 2 The amount of hours used per day (% hours, n=29) for the different preset levels during the intervention period.