
Figures & data
Figure 1 Flow chart of the patients included in the care utilization analysis.
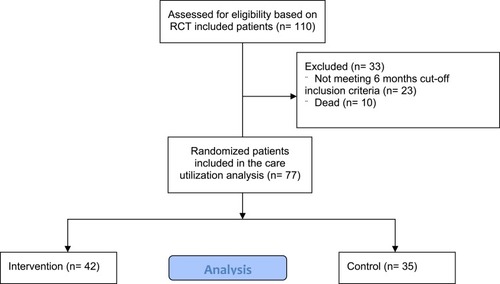
Table 1 Baseline Demographics and Multimorbidity of Study Groups (Intervention Compared to Control)
Table 2 Comparison of Care Utilization Variables for 24 Months Pre- and 6 Months Post Randomization
Table 3 Distribution of Median Visits per Patient and Median Number of Diagnoses per Age Group