Figures & data
Table 1 Age distribution in five year age categories
Figure 1 Age and compliance scatter plots for men.
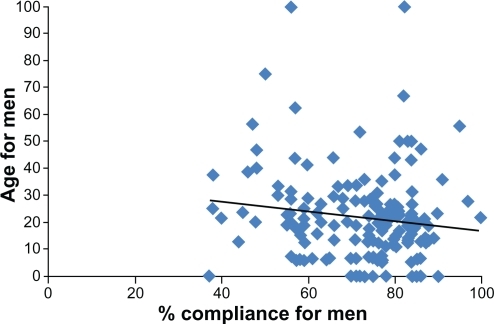
Figure 2 Age and compliance scatter plots for women.
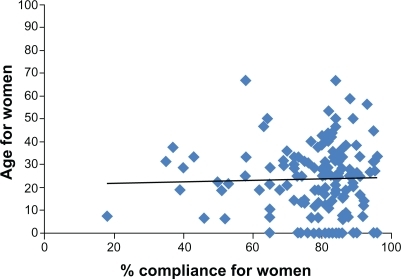
Figure 3 Gender and age in the cohort of stroke patients in this analysis.
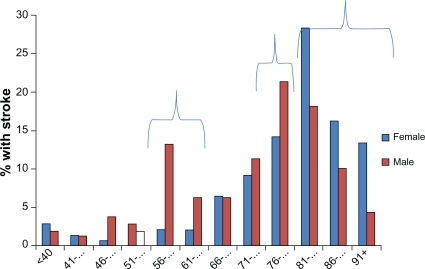
Figure 4 Likelihood of poor compliance occurring in each 5-year age category.
Abbreviations: CI, confidence interval; OR, odds ratio.
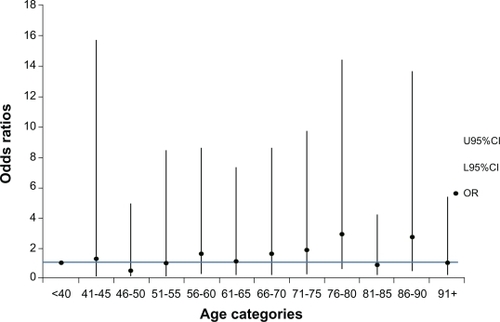
Figure 5 Likelihood of poor compliance occurring in each 10-year age category.
Abbreviations: CI, confidence interval; OR, odds ratio.
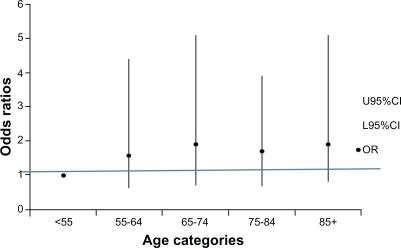
Table 2 Odds ratio of poor compliance occurring in 10 year age groupings, adjusted by gender