Figures & data
Table 2 Eligibility for process indicator care, care adherence and association with age
Figure 1 Simple causal pathway of variables associated with a patient journey following acute stroke.
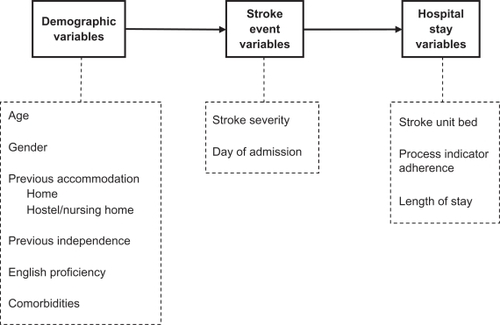
Table 1 Patients characteristics (n = 300)
Table 3 Univariate model of independent variables (excluding age) and adherence to process indicators
Appendix 1 Correlations between age and other predictor variables
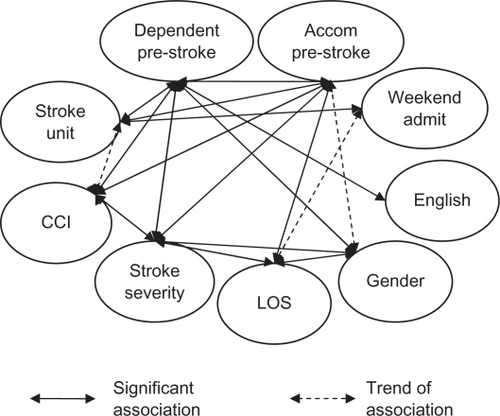
Figure 2 Confounding relationships between non-age variables.
Abbreviations: CCI, Charlson Comorbidity Index; LOS, length of stay.
Appendix 2 Matrix of non-age variables
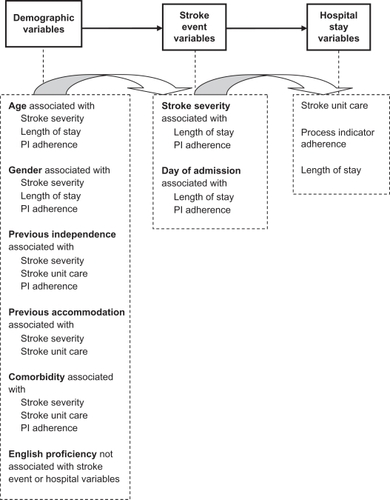
Figure 3 Relationships between variables for the patient journey with acute stroke.
Abbreviation: PI, process indicator.