
Figures & data
Figure 1 HexCom form (previous page): analysis of needs.
Notes: Collects information about the Complexity observed in each domain and subdomain of Necessity, at the beginning (I) and at the end (F) of the Follow-up, with 3 complexity levels: High (H) (Refractory situation), Medium (M) (Difficult situation), Low (L) (Without Complexity), or N if it cannot be assessed. R&S: Resources & Strengths; STE: Suitability of treatment efforts; DHD: Desire to hasten death; SLD: Situation during last days of life. Interv: interveners. Soc: Social worker; Psyc: Psychologist; Vol: Volunteer; PCU: Palliative care unit; CHC: Hospital.
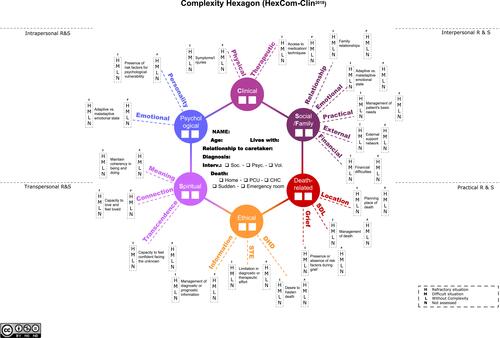
Figure 2 HexCom form (later page): analysis of resources and strengths.
Notes: Collects information about Resources and Strengths observed in the home and that help sustain the actual situation. It is indicated if resource determination is detected.
Abbreviation: R&S, resources and strengths.
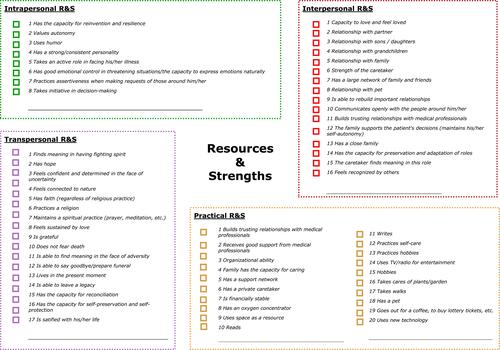
Table 1 Main Variables: Total and per Disease Group
Figure 3 Comparison of complexity scores of each disease group.
Note: The dashed line represents the median Complexity Score of all participants.
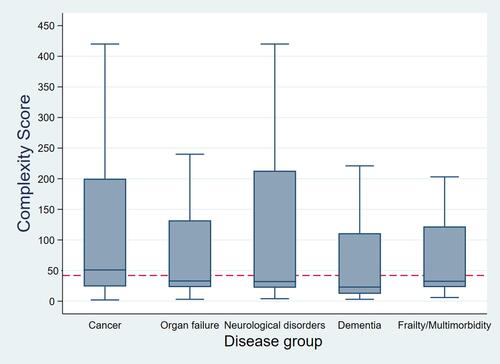
Table 2 Level of Complexity per Domain, Subdomain, and Global
Table 3 Differences in Complexity Across Disease Groups: Patients with Moderate or High Complexity (N%)
Table 4 Resources and Strengths Used to Face the End-of-Life Across Disease Groups