Figures & data
Table 1 Demographic Characteristics of the Surveyed Population (n=640)
Figure 1 Usage rate of information and communication technologies (ICTs) for communication, interaction, and academic purposes. (A) Frequency of individuals using each ICT to communicate with other physicians and patients. (B) Frequency of individuals interacting with other physicians and patients through each ICT. (C) Frequency of individuals using each ICT for academic purposes.
Abbreviations: SMS, short message service; RG, ResearchGate.
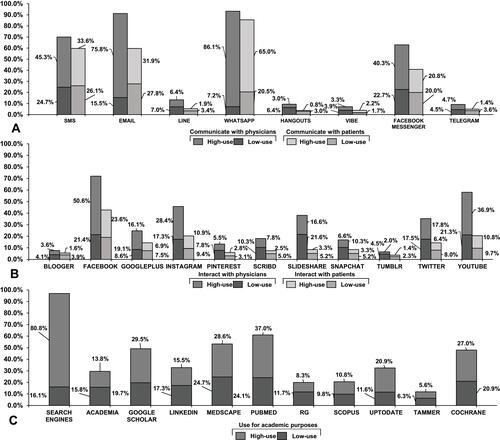
Figure 2 Overall frequencies of perceptions and barriers of ICTs among Ecuadorian physicians. (A) Frequencies of each perception are shown as percentages (I, “Promote private medical services”; II, “Search for new job opportunities and/or professional development”; III, “Participate in research projects”; IV, “Promote health”; V, “Work in group with colleagues”; VI, “Dislike to interact with colleagues through such channels”; VII, “Prefer traditional channels of communications”). (B) Frequencies of each barrier are shown as percentages (A, “Concerned about privacy or security about personal and/or patient information”; B, “Do not have access to mobile internet”; C, “Do not have access to internet at work”; D, “Do not have enough time to neither learn how to use them or use them”).
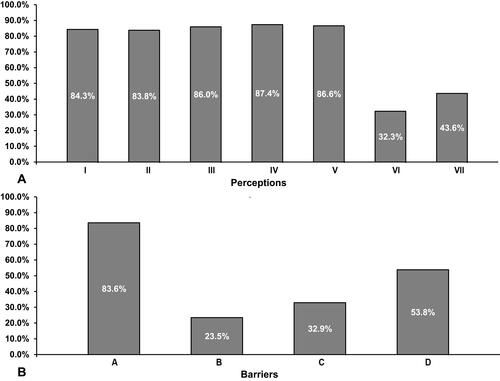
Figure 3 Perceptions of ICTs by physicians according to selected demographic variables. Seven perceptions are represented on each heptagon. All proportions depicted are individuals that agree with the statement. Physicians on light gray and dark gray represent a dichotomy highlighted below each heptagon and are compared to assess the strength of correlation. I, “Promote private medical services” II, “Search for new job opportunities and/or professional development” III, “Participate in research projects” IV, “Promote health” V, “Work in group with colleagues” VI, “Dislike to interact with colleagues through such channels” VII, “Prefer traditional channels of communications” astatistically significant (p<0.05). Φ, Phi coefficient.
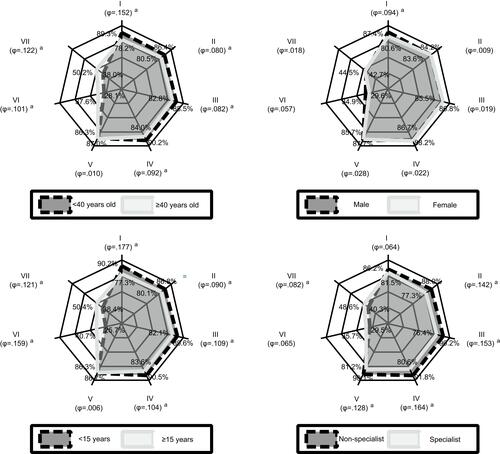
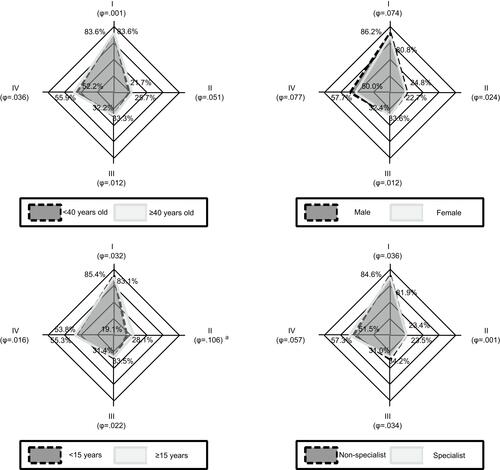
Figure 4 Barriers of ICTs by physicians according to selected demographic variables. Four barriers are represented on each diamond. All proportions depicted are individuals that agree with the statement. Physicians on light gray and dark gray represent a dichotomy highlighted below each diamond and are compared to assess the strength of correlation. I, “Concerned about privacy or security about personal and/or patient information” II, “Do not have access to mobile internet” III, “Do not have access to internet at work” IV, “Do not have enough time to neither learn how to use them or use them” aStatistically significant (p<0.05). Φ, Phi coefficient.