Figures & data
Table 1 Recommended Evaluations Following Initial Diagnosis in Individuals with GACI
Table 2 GACI: Frequency of Select Features
Figure 1 Overview of Rare Monogenic Diseases with Vascular Calcification Due to Mutation of the Purine Metabolism Pathway. ATP gains access via ATP transporters into extracellular space, where it is hydrolyzed by ENPP1 into AMP and PPi. AMP is then hydrolyzed by CD73 into adenosine and Pi while PPi is hydrolyzed by TNAP into inorganic phosphate. PiT1/2 (Na+-dependent Pi cotransporter) mediates cellular Pi uptake and transport into the cell. PPi is a potent inhibitor of calcification. Adenosine can interact with adenosine receptors and suppress TNAP expression, as well as have various effects based on specific receptors. The specific substrate for ABCC6 has yet to be identified. ENPP1, CD73, and ABCC6 deficiencies drive the molecular pathophysiology of several monogenic diseases associated with arterial calcification (GACI, ACDC, and PXE). Reproduced with permission from Cudrici CD et al.Citation33
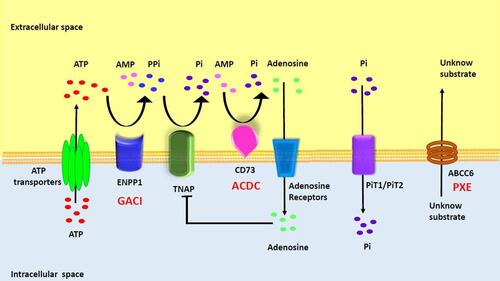
Table 3 Clinical Spectrum of ENPP1 and ABCC6 Deficiency Syndromes
Figure 2 Gross, radiographic, and histologic images of the heart and coronary artery from a 8-months-old male with GACI. Radiographs of excised coronary arteries (CA) (A) demonstrate focal calcification of all four major branches [left main, left anterior descending (LAD), left circumflex (LCX), and right CA (RCA)] and smaller branches. (B) Mid-left and right ventricular slices of the heart show dilatation of the LV and subendocardial circumferential healed myocardial infarction, along with transmural scarring of the posterolateral wall of LV. (C–H). Hematoxylin and eosin-stained sections of the major coronary arteries and branch vessels demonstrating moderate to severe luminal narrowing with or without medial calcification (A, B, E–H) are reproduced with permission from Federici et alCitation58.
![Figure 2 Gross, radiographic, and histologic images of the heart and coronary artery from a 8-months-old male with GACI. Radiographs of excised coronary arteries (CA) (A) demonstrate focal calcification of all four major branches [left main, left anterior descending (LAD), left circumflex (LCX), and right CA (RCA)] and smaller branches. (B) Mid-left and right ventricular slices of the heart show dilatation of the LV and subendocardial circumferential healed myocardial infarction, along with transmural scarring of the posterolateral wall of LV. (C–H). Hematoxylin and eosin-stained sections of the major coronary arteries and branch vessels demonstrating moderate to severe luminal narrowing with or without medial calcification (A, B, E–H) are reproduced with permission from Federici et alCitation58.](/cms/asset/c2787929-64b8-41bd-bed4-8939c4df9098/djmd_a_12169941_f0002_c.jpg)
Figure 3 Representative histologic sections of the right coronary artery, from the same case shown in . Top row: low-power images of RCA stained with Movat Pentachrome (A), hematoxylin and eosin (B), and triple immunofluorescence for SMC and inflammatory markers [macrophage (CD68) and T cells (CD3)], and α-actin (SMA) (C). Early- (D–F), intermediate- (G–I), and late-phase (J–O) lesion morphologies are shown. There is moderate luminal narrowing with SMC-rich neointima. Regions of interest shown at higher magnification are within the colored boxed areas on the low-magnification image (A). Areas highlighted by the red box (D–F) show early calcification with degradation of the IEL and relative absence of inflammation. The purple-boxed area (G–I) represents fragmentation and focal thickening of elastic fibers with calcification, along with early inflammation (macrophages, yellow in panel (I) and neoangiogenesis (black arrow). A more advanced late phase (black in panel (A) and yellow boxes in panel (J) shows more prominent calcification (M, alizarin red) and neoangiogenesis (black arrows in panel (J) with inflammatory infiltrate (C and L) consisting mostly of macrophages and T cells together with a loss of adjacent SMCs. These areas were also typically positive for the calcification markers, osteoprotegerin(N) and receptor activator of the nuclear κB (RANK) (O). (A–O) are reproduced with permission from Federici et al.Citation58
![Figure 3 Representative histologic sections of the right coronary artery, from the same case shown in Figure 2. Top row: low-power images of RCA stained with Movat Pentachrome (A), hematoxylin and eosin (B), and triple immunofluorescence for SMC and inflammatory markers [macrophage (CD68) and T cells (CD3)], and α-actin (SMA) (C). Early- (D–F), intermediate- (G–I), and late-phase (J–O) lesion morphologies are shown. There is moderate luminal narrowing with SMC-rich neointima. Regions of interest shown at higher magnification are within the colored boxed areas on the low-magnification image (A). Areas highlighted by the red box (D–F) show early calcification with degradation of the IEL and relative absence of inflammation. The purple-boxed area (G–I) represents fragmentation and focal thickening of elastic fibers with calcification, along with early inflammation (macrophages, yellow in panel (I) and neoangiogenesis (black arrow). A more advanced late phase (black in panel (A) and yellow boxes in panel (J) shows more prominent calcification (M, alizarin red) and neoangiogenesis (black arrows in panel (J) with inflammatory infiltrate (C and L) consisting mostly of macrophages and T cells together with a loss of adjacent SMCs. These areas were also typically positive for the calcification markers, osteoprotegerin(N) and receptor activator of the nuclear κB (RANK) (O). (A–O) are reproduced with permission from Federici et al.Citation58](/cms/asset/4cb72363-d0de-41bf-800c-4b00f2de33ce/djmd_a_12169941_f0003_c.jpg)
Figure 4 Representative histologic sections of the aorta and major branches with varying degrees of IEL fragmentation and calcification. Low-power images of the thoracic aorta (A), abdominal aorta (B), left subclavian artery (C), left common carotid artery (D), celiac artery (E), superior mesenteric artery (F), renal artery (G), and left common iliac artery (H) showing varying degrees of IEL fragmentation and calcificationLeft images are stained with hematoxylin and eosin stain and right images are stained with von Kossa stain. (A–H) are reproduced with permission from Federici et al.Citation58
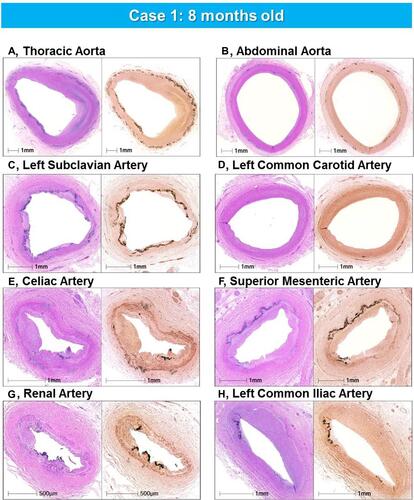
Figure 5 Radiography and histologic images of the coronary arteries and myocardium from a 20-days-old female infant with GACI. Radiograph of the heart shows calcification of the major coronary arteries: RCA (yellow arrows), LAD (red arrows), and LCX (white arrows) (A). Proximal RCA (B–E), proximal LAD (F–I), and proximal LCX (J–M) show moderate to severe luminal narrowing with circumferential calcification of IEL. Images B, C, F, G, J, and K of coronary arteries are stained with hematoxylin and eosin and Movat Pentachrome D, E, H, I, L, and M, stains, respectively. The boxed areas in the left panels, B, D, F, H, J, and L, are shown at high power in the right panels, C, E, G, I, K, and M. Panels C and K show bone metaplasia within calcified areas. Histologic section of the left ventricular wall showing normal histology of the intramyocardial coronary arteries [boxed area in (O); note an absence of calcification and intimal proliferation (P and Q)]. (O and P) are stained by hematoxylin and eosin; (Q) is stained by Movat pentachrome stain.
![Figure 5 Radiography and histologic images of the coronary arteries and myocardium from a 20-days-old female infant with GACI. Radiograph of the heart shows calcification of the major coronary arteries: RCA (yellow arrows), LAD (red arrows), and LCX (white arrows) (A). Proximal RCA (B–E), proximal LAD (F–I), and proximal LCX (J–M) show moderate to severe luminal narrowing with circumferential calcification of IEL. Images B, C, F, G, J, and K of coronary arteries are stained with hematoxylin and eosin and Movat Pentachrome D, E, H, I, L, and M, stains, respectively. The boxed areas in the left panels, B, D, F, H, J, and L, are shown at high power in the right panels, C, E, G, I, K, and M. Panels C and K show bone metaplasia within calcified areas. Histologic section of the left ventricular wall showing normal histology of the intramyocardial coronary arteries [boxed area in (O); note an absence of calcification and intimal proliferation (P and Q)]. (O and P) are stained by hematoxylin and eosin; (Q) is stained by Movat pentachrome stain.](/cms/asset/e0b7a07c-3b0d-4943-97ad-80cda51d5176/djmd_a_12169941_f0005_c.jpg)
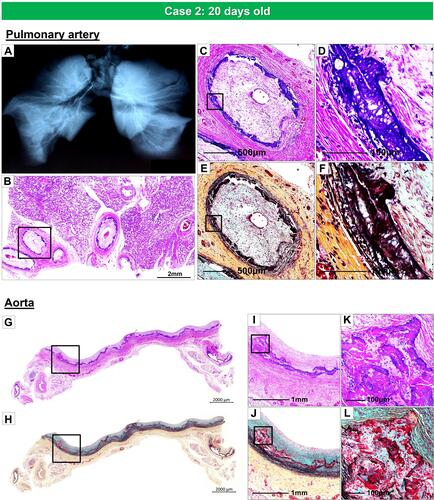
Figure 6 Radiography of the lungs and histology of pulmonary artery and thoracic aorta, from the same case as . Radiography of right and left lungs demonstrates diffuse calcification of pulmonary arteries (A). (B). Histologic section of the right lung showing diffuse narrowing of multiple branches of the pulmonary arteries (hematoxylin and eosin). The boxed area in panel B is shown at higher magnification, demonstrating severe luminal narrowing from intimal proliferation and circumferential calcification (C–F). Images (C and D) are stained with hematoxylin and eosin and (E and F) are stained with Movat Pentachrome. A section of the thoracic aorta showing circumferential calcification (G and H). (I and J) are higher-power magnifications from the boxed areas in (G and H), showing diffuse calcification of the media. (K and L) show an area of bone metaplasia within the lesions of calcification. The upper and lower panels are stained with hematoxylin and eosin (G, I, and K) and Movat Pentachrome (H, J, and L).