
Figures & data
Figure 1 PRISMA flow diagram.
Note: Adapted from Liberati A, Altman DG, Tetzlaff J, et al. The PRISMA statement for reporting systematic reviews and meta-analyses of studies that evaluate health care interventions: explanation and elaboration. Ann Intern Med. 2009;151(4):65–94.Citation9
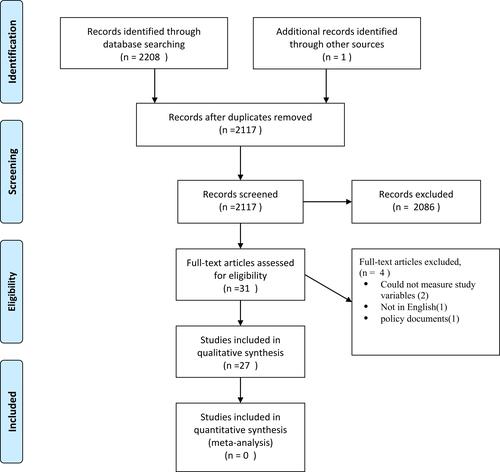
Table 1 A Description of the Articles Utilised
Figure 2 Kenya and South Africa National Neonatal Mortality rate, (per 1000 live births).
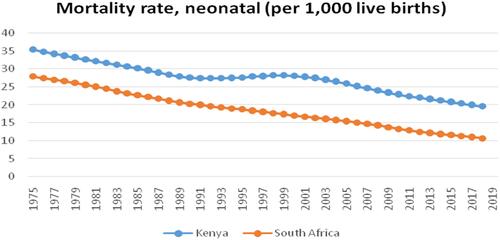
Table 2 Percentage Distribution of Causes of Neonatal Deaths in 2018: South Africa and Kenya