
Figures & data
Figure 1 A depiction of the referral process in 2015 before the introduction of the DMDT; illustrating the steps taken to appropriately triage the referral before making the first management decision.
Abbreviation: MDT, multidisciplinary team meeting.
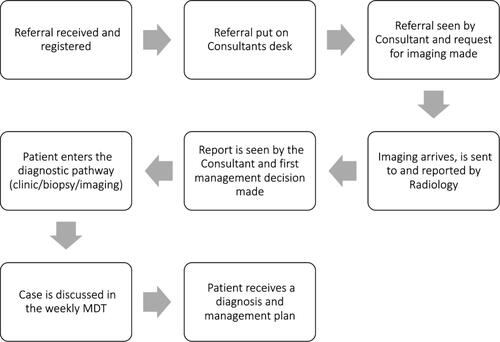
Figure 2 A depiction of the referral process in 2018 after the introduction of the DMDT; illustrating the steps taken to appropriately triage the referral and make a first management decision.
Abbreviations: MDT, multidisciplinary team meeting; CNS, clinical nurse specialist; DMDT, diagnostic multidisciplinary team meeting.
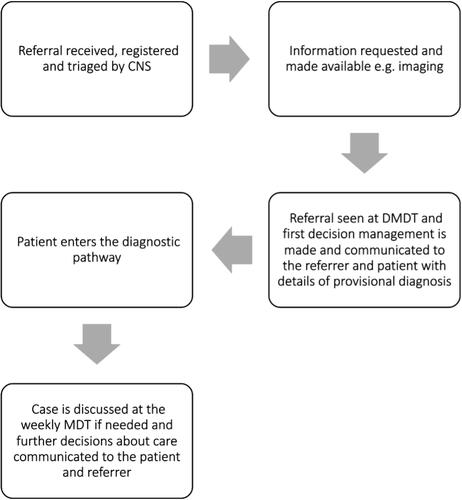
Table 1 Demographic Data for the 2015 and 2018 Cohorts
Table 2 Provisional Diagnosis at DMDT Data (2018)
Table 3 Outcomes of First Management Decision (2015)
Table 4 Outcomes of First Management Decision (2018)