
Figures & data
Figure 1 Overview of mTOR-TSC regulation and upstream and downstream mediators. Mutations in either TSC1 or TSC2 genes lead to hyperactivation of the downstream mTOR pathway by suppression of Rheb-mediated mTORC1 inhibition. The TSC1-TSC2 protein complex integrates cues such as nutrients, growth factors, hormones, and mitogens to regulate the activity of mTOR. mTOR complexes 1 and 2 are mediators of important cellular functions. Some of the downstream targets of mTORC1 were already clearly identified, including S6K1 and 4E-BP1 proteins, which play a major role in the regulation of cell growth, proliferation, and metabolism. TSC1 and TSC2 proteins have additional roles besides the modulation of mTOR, since inhibition of B-Raf kinase via Rheb is an mTOR-independent function of tuberin. Sirolimus and everolimus are effective inhibitors of mTORC1 via FKBP12.
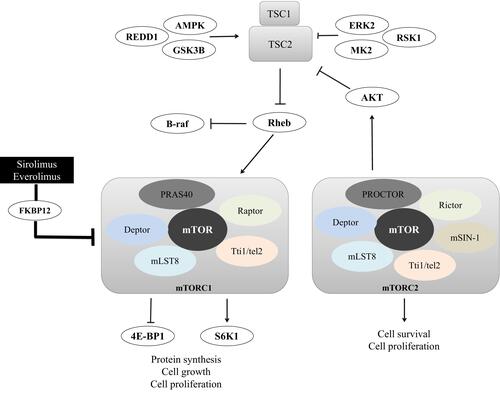
Table 1 Diagnostic Criteria for Tuberous Sclerosis and Testing Recommendations of Asymptomatic Patients (Adapted from Northrup H et alCitation2)
Figure 2 Small SEGA of the left hemisphere, in a child diagnosed with TSC. The image represents a T1-weighted MRI axial section after intravenous gadolinium administration (arrow points to SEGA).
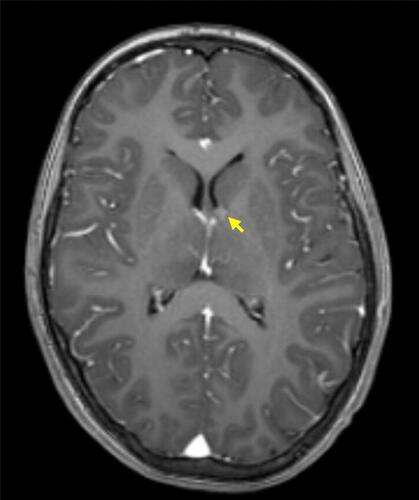
Figure 3 Large angiomyolipoma adjacent to the right kidney. The image is a sagittal section of a contrast-enhanced Computed Tomography scan obtained from an adult patient diagnosed with TSC, which reveals a lobulated right kidney and a voluminous mass (arrow), consisting essentially of fat, adjacent to it.
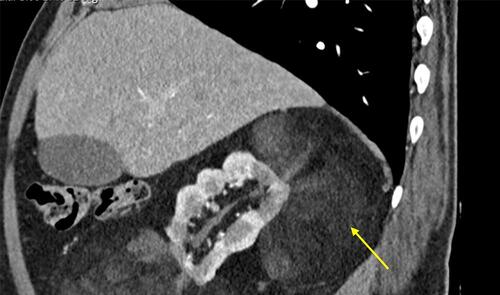
Table 2 Pharmacological Characterization, Clinical Indications and Adverse Effects of mTOR Inhibitors for Tuberous Sclerosis Complex Treatment (Adapted from Palavra F et alCitation5)