Figures & data
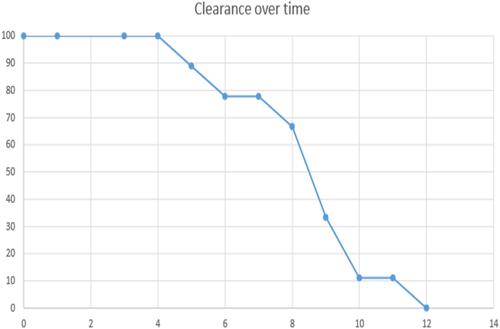
Figure 1 The follow-up algorithm for a confirmed case of an HCW with COVID-19.
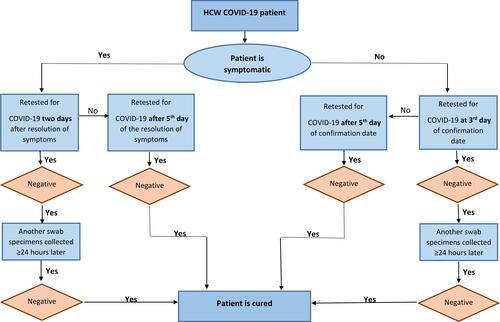
Table 1 Demographic and Clinical Characteristics for the Quarantined Individuals
Table 2 N = 301, Positive Cases = 18. Description of the 18 Screened Cases That Tested Positive Through the PCR Screening for COVID-19 Among KFHU’s Staff Living in Qatif
Figure 2 Viral clearance in days (Kaplan–Meier curve), where the X-axis represents the time in days while the Y-axis shows the percentage of cases still shedding the virus (median = 9 days ± 1.307).