
Figures & data
Figure 1 Nonconveyed cases included in the study.
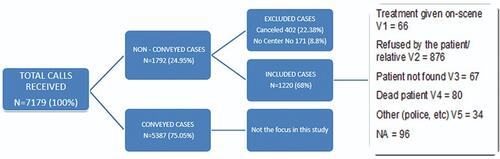
Table 1 Center vs Categories of Nonconveyed Cases
Figure 2 Station vs category for nonconveyed cases.
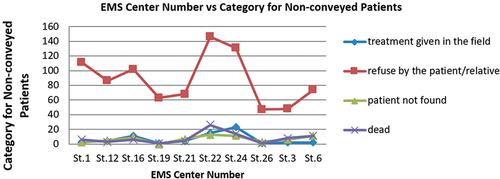
Table 2 Centers vs On-Scene Time Intervals
Figure 3 EMS center vs on-scene time interval of nonconveyed cases.
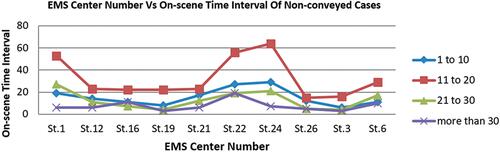
Table 3 Final Logistic Regression Model of Categories Associated with Nonconveyed Cases
Table 4 Distribution of Categories of Nonconveyed Cases Among Centers
Table 5 Distribution of Categories of On-Scene Time Interval Among Centers
Table 6 Correlation Coefficients Among Categories of Nonconveyed Cases
Table 7 Correlation Coefficients Among Categories of On-Scene Time Interval
Table 8 Polynomial Regression Analysis o Number of Cases and On-Scene Time–Interval Categories