
Figures & data
Figure 1 Service workflow.
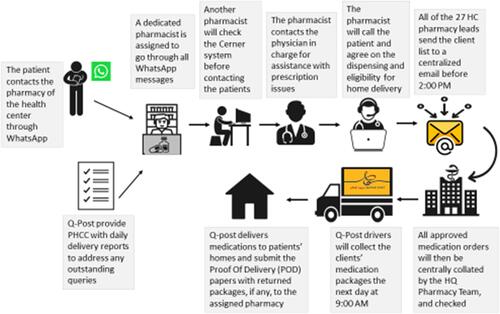
Table 1 Total Number and Percentage of Medications Successfully Delivered to Patients’ Homes (March to September 2020)
Figure 2 The total number of patients that received their delivered medications.
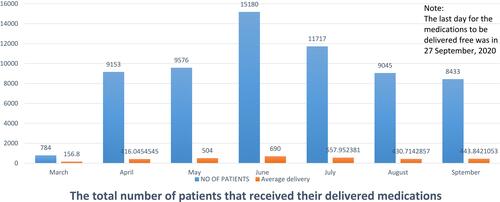
Table 2 Total Number and Percentage of Medications Successfully Delivered to Patients’ Homes per Geographical Region (March to July 2020)
Table 3 Top Medical Conditions and Number of Medications Dispensed for Home Delivery Patients