
Figures & data
Table 1 Characteristics of the Participants
Table 2 Differences Between Age, Gender, Hospital Type, Insurance Status, Marital Status, SAHS, Education Level, Monthly Income, Insurance Class, and Occupation Categories and Mean Patient’s Trust Score
Figure 1 Stem and leaf test between gender and mean of patient trust level.
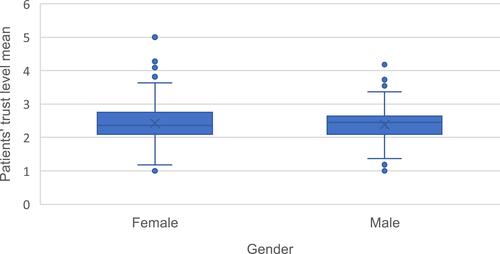
Figure 2 Stem and leaf test between insurance status and mean level of trust.
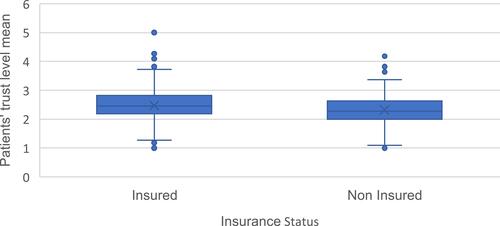
Figure 3 Stem and leaf test between hospital type and mean level of patient trust.

Table 3 Multivariable Linear Regression Assessing Differences Between Age, Gender, Hospital Type, Insurance Status, Marital Status, SAHS, Education Level, Monthly Income, Insurance Class, and Occupation Categories and Mean Patient’s Trust Score