Figures & data
Figure 1 PRISMA flow chart diagram for systematic review and meta-analysis.
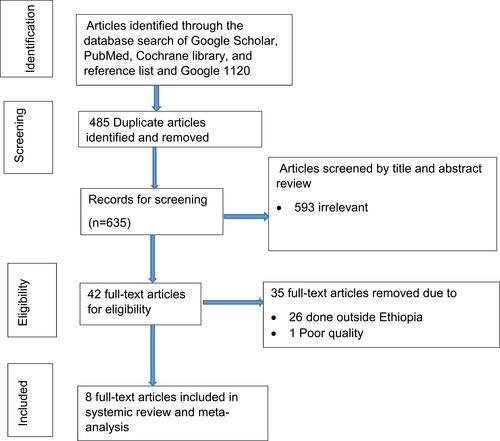
Table 1 Descriptive Summary of 8 Studies in Systematic Review of the Prevalence of Job Satisfaction of Health Care Professionals in Ethiopia
Figure 2 The frost plot studies on the prevalence of job satisfaction of health care professionals in Ethiopia.
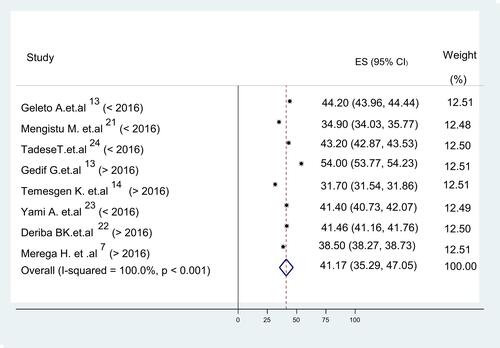
Figure 3 Funnel plot to of job satisfaction of healthcare professionals in Ethiopia.
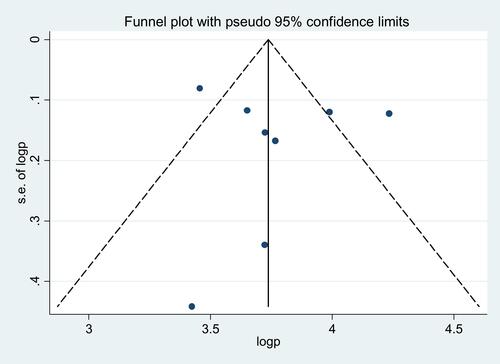
Figure 4 Funnel plot fill and trim analysis of job satisfaction of healthcare professionals in Ethiopia.
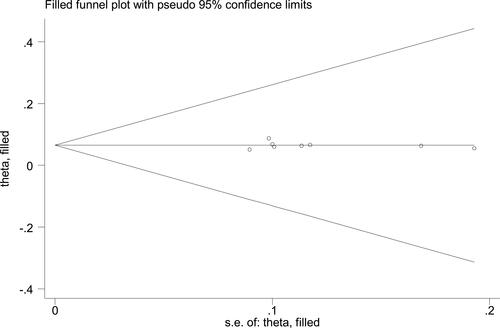
Figure 5 The subgroup analysis towards job satisfaction of healthcare professionals in Ethiopia.
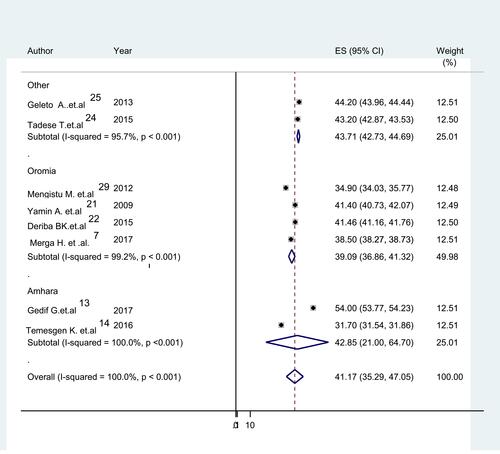
Table 2 Subgroup Analysis of Pooled Prevalence Job Satisfaction of Health Care Professionals in Ethiopia
Table 3 Meta-Regression Analysis of Studies Job Satisfaction of Health Care Professionals in Ethiopia, 2020
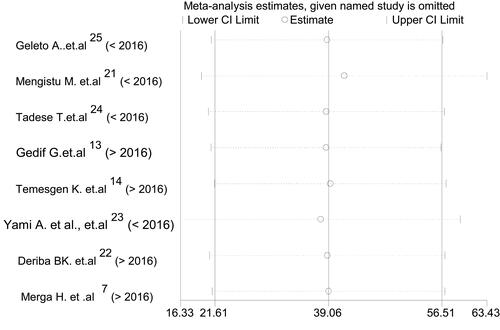
Figure 6 Sensitivity analysis which indicates the job satisfaction of health care professionals in Ethiopia.