
Figures & data
Figure 1 Percentage of women receiving family planning text messages. As shown in , radio (42.8%) was the most commonly cited source of family planning messages followed by drama (31.8%) and poster (27%).
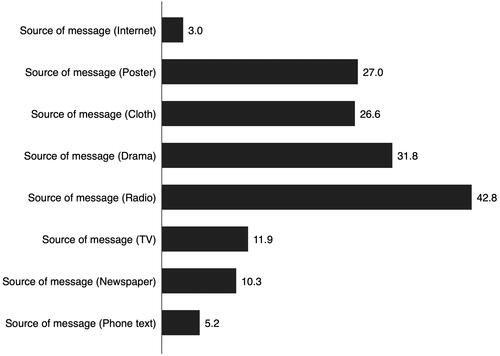
Figure 2 Urban rural difference in the percentage of women receiving family planning text messages. Its shows the urban rural difference in receiving family planning messages by the types of sources. It was evident that the percentages were noticeably higher in urban for all types of sources with the largest difference being reported for internet (8% in urban vs 1.6% in rural).
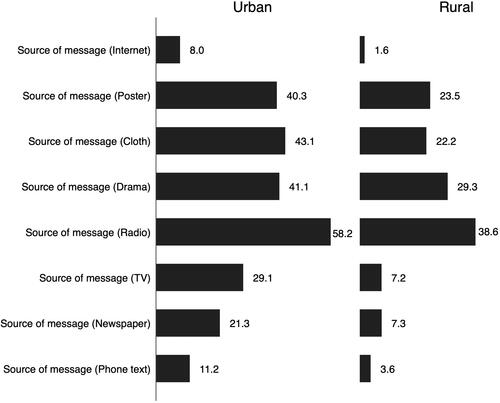
Table 1 Prevalence of Maternal Healthcare Use by Sociodemographic Variables (N=13,217)
Table 2 Prevalence of Maternal Healthcare Use by Sources of FP Message
Table 3 Association Between of Maternal Healthcare Use by Media Use Variables