
Figures & data
Table 1 Demographics of Female Sex Workers (FSWs) in Six Consecutive Cross-Sectional Surveys
Table 2 Knowledge, Behavioral, Intervention and Serological Characteristics of Female Sex Workers in Six Consecutive Cross-Sectional Surveys
Table 3 Comparison of Demographic and Behavioral Characteristics of Syphilis Positive and Syphilis Negative Female Sex Workers
Figure 1 Syphilis prevalence in female sex workers (FSWs) from 2014 to 2019.
Note: *Significant difference (p < 0.05) between high- and low-grade FSWs.
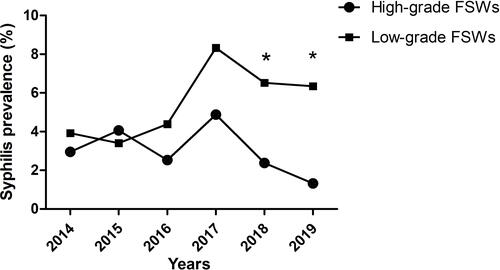
Table 4 Odds Ratios (OR) and 95 Confidence Intervals (CI) of Syphilis Among All Female Sex Workers (FSWs) and According to Location of Venues