Figures & data
Table 1 Baseline Patient Characteristics
Figure 1 Patient flowchart. Flow diagram of patient recruitment and follow-up.
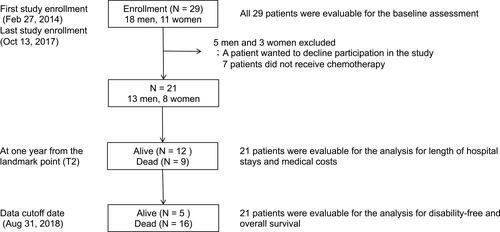
Table 2 Changes in Physical Activity from Pretreatment to T2
Figure 2 Overall and disability-free survival curves. Panel (A) Kaplan-Meier curve of overall survival from T2. Panel (B) Kaplan-Meier curve of disability-free survival from T2. A solid line indicates active patients and a dotted line indicates inactive patients. P-values were calculated using Log rank tests. A disabling event is defined as a decrease in Barthel Index from the pretreatment value by 10 points or higher. The overall and disability-free survival was censored on the final visit for patients whose deaths or disabling events were not confirmed. *T2 was 12 ± 4 weeks from enrolment.
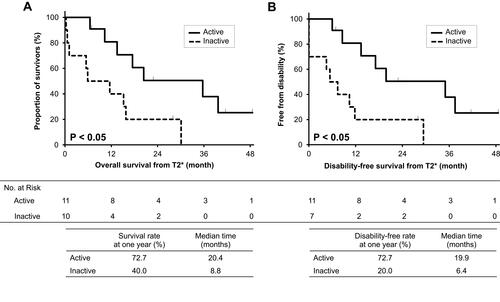
Table 3 Differences in Socioeconomic Parameters of Cancer Treatment in the First Year
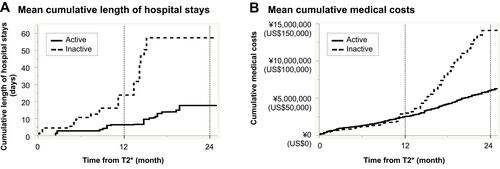
Figure 3 Difference between active and inactive patients in terms of cumulative length of hospital stays and medical costs from T2. Curves of cumulative functions for the length of hospital stays panel (A) and medical costs panel (B) in active patients (solid line) and inactive patients (dotted line). *T2 was 12 ± 4 weeks from enrolment.