Figures & data
Table 1 Descriptive Statistics of the Survey Responders
Table 2 Descriptive Statistics of the Survey Responders Post Propensity Score Matching
Table 3 Descriptive Statistics of the Missing Activities (“Which of the Following Activities are You Missing the Most During This Quarantine Period?”) During the COVID-19 Quarantine (Post-Propensity Match Sample)
Table 4 Descriptive Statistics of the Responder’s Feeling (“Since the Government Started the Restrictive Measures Since You are in Quarantine, What Do You Feel When You Think About the Pandemic and the Coronavirus?”) During the COVID-19 Quarantine (Post-Propensity Match Sample)
Table 5 Descriptive Statistics of the Responder’s Emotional Status During the COVID-19 Quarantine (Post-Propensity Match Sample) (“the Following Questions Refer to the Quarantine Period”)
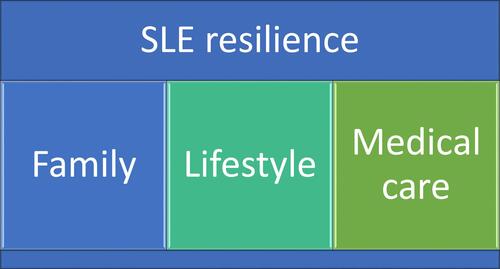
Figure 1 The three pillars of lupus patients’ resilience.