
Figures & data
Figure 1 Daily new cases in Saudi Arabia.
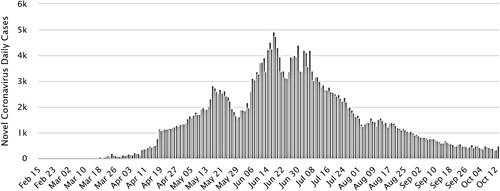
Figure 2 Number of patients visited the emergency room between 2018 to 2020.
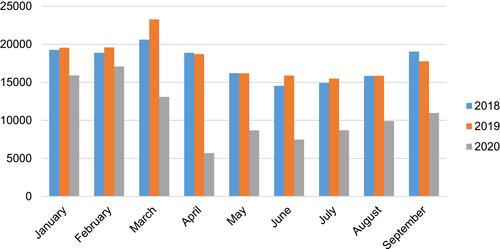
Table 1 Number of Patients Attending ED in 2018, 2019 and 2020 from January to September
Table 2 Descriptive Statistics for 2018 and 2019
Table 3 Estimation for Paired Difference of the Population Mean for 2018 and 2019
Table 4 Descriptive Statistics for 2019 and 2020
Table 5 Estimation for Paired Difference of the Population Mean for 2019 and 2020
Table 6 Patient and Treatment Classifications
Table 7 Shows the Number of Adult Patients with an Existing File Attending the ED
Table 8 Shows the Number of New Adult Patients Attending the ED
Table 9 Shows the Number of Existing Pediatric Patients Attending the ED
Table 10 Shows the Number of New Pediatric Patients Attending the ED