
Figures & data
Figure 1 Flowchart of participants.
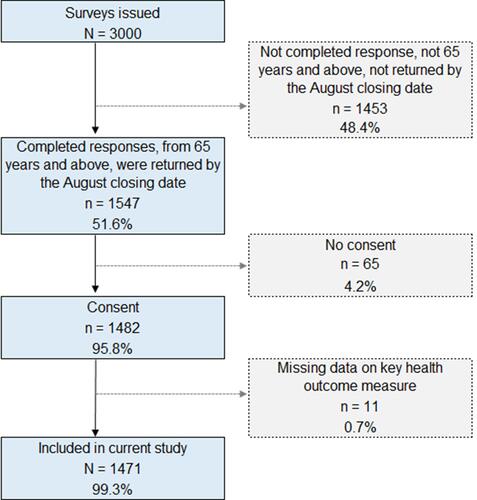
Table 1 Descriptive Statistics of Participants’ Physical, Environmental, and Psychological Characteristics
Table 2 Bivariate Associations of Physical, Environmental, and Psychological Variables with Quality of Life
Table 3 Correlation Matrix of Physical, Environmental, and Psychological Exposure Variables (P<0.05 in Blue and P<0.01 in Red)
Table 4 Generalized Linear Model on Quality of Life Testing the Main Effects of Physical, Environmental, and Psychological Variables, and Their Interaction with Sense of Coherence