Figures & data
Table 1 Demographic Information and Professional Qualifications
Table 2 Median Score for Organisation Level RCC Items, Arranged in Descending Order
Table 3 Median Scores for Team Level RCC Items, Arranged in Descending Order
Table 4 Median Scores for Individual Level RCC Items, Arranged in Descending Order
Table 5 Reported Frequency of Personal Barriers and Motivators to Conducting Research, Arranged in Descending Order
Table 6 Codes from Qualitative Analysis of Final Free Text Question
Table 7 Characteristics of Publications and Projects from Medical Doctors in 2018 and 2019
Table 8 Mean Scores for Team Level RCC Items and Publication and Projects per FTE, Separated by Broad Specialty Group, Arranged in Descending Order
Figure 1 Relationship between Projects per FTE of teams and the teams’ mean RCC scores.
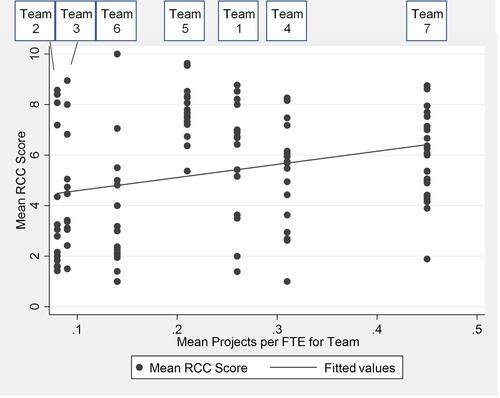
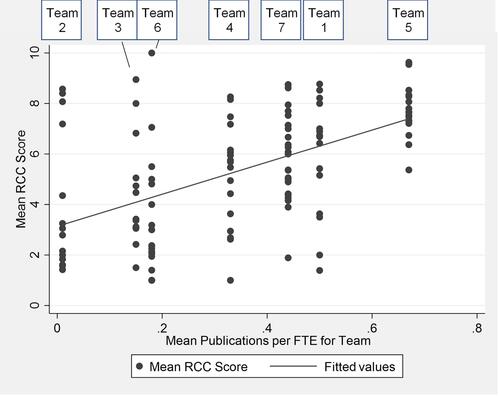
Figure 2 Relationship between Publications per FTE of teams and teams’ mean RCC scores.