Figures & data
Table 1 Test of Association Between the Effectiveness of Government Intervention Measures Taken to Cease COVID-19 Pandemic in Dire Dawa City in the Year 2020 and Indicator Variables
Table 2 Test of Association Between Respondents’ Awareness About the Symptoms of the Novel Coronavirus and Government Intervention Effectiveness in Dire Dawa City in the Year 2020
Table 3 Test of Association Between Prevention Measures Practice Taken by the Respondents to Prevent Infection from the Novel Coronavirus and Government Intervention Effectiveness in Dire Dawa City in the Year 2020
Table 4 Test of Association Between Effective Preventive Methods of the Pandemic and Government Intervention Effectiveness in Dire Dawa City in 2020
Table 5 Test of Association Between Short-Long Term Effects of Government Intervention and Its Effectiveness in Dire Dawa City in the Year 2020
Table 6 Test of Association Between Government Intervention Effectiveness to Cease the Disease and Its Cons on the Respondents’ Educational Activities in Dire Dawa City in the Year 2020
Table 7 Test of Association Between Government Intervention Effectiveness to Cease the COVID-19 and Its Positive Impact on the Respondents’ Activities
Table 8 Test of Association Between Government Intervention Effectiveness to Cease the COVID-19 and the Respondents’ Trust in the Sources of Information in Their Reporting About the Outbreak
Table 9 Test of Association Between Government Intervention Effectiveness to Cease the COVID-19 and Types Information Respondents Mostly Need Related to
Table 10 Test of Association Between Government Intervention Effectiveness to Cease the COVID-19 and the Frequency of Respondent to Inform Themselves About the Novel Coronavirus per Day
Table 11 Test of Association Between Government Intervention Effectiveness to Cease the COVID-19 and Respondents Use of Sources of Information to Stay Informed About Novel Coronavirus
Table 12 Test of Association Between Government Intervention Effectiveness to Cease the COVID-19 and Trust (Perceptions) of Respondents in Institutions Those Inform Them About the Disease
Table 13 Summary Statistics of the Likelihood Ratio Test
Table 14 Model Summary
Table 15 Hosmer and Lemeshow Test
Table 16 Classification Table for the Logistic Regression
Table 17 Variables in the Final Multiple Classical Binary Logistic Regression Model
Figure 1 Bar chart, the respondent educators’ level of knowledge about the pandemic in Dire Dawa City in 2020. From Figure 1, one can see that majority of the respondents have good knowledge about the pandemic in Dire Dawa City at the time of the study.
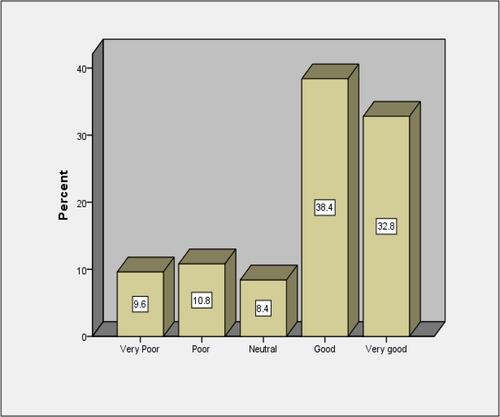
Figure 2 The rating of the timing of government intervention measures to scrub the disease in Dire Dawa City. From Figure 2, one can visualize that 49.2% of the respondent educators rate the government's intervention measures timing was not early in Dire Dawa City.
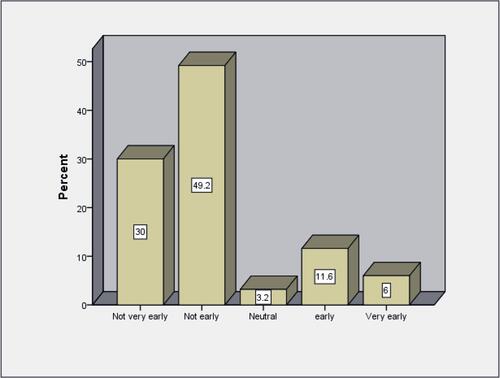
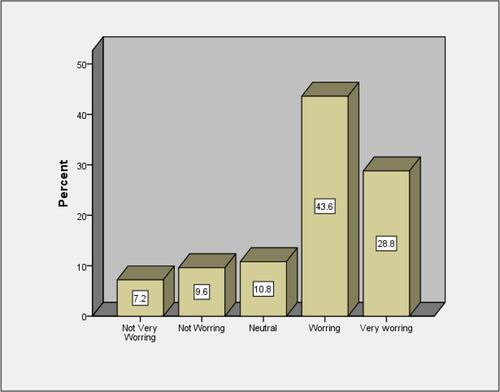
Figure 3 Bar chart shows the respondents, level of worry or feeling level about COVID-19 in Dire Dawa City. From Figure 3, one can visualize that 43.6% of the respondent educators’ rate they felt worrying about the pandemic in Dire Dawa City.