Figures & data
Table 1 Distribution according to gender (n), age (median and percentiles 25–75), civil status, profession, and diagnosis (n) in participants with full-time sickness benefit (group 1) and with part-time or no sickness benefit (group 2) at the end of the follow-up period
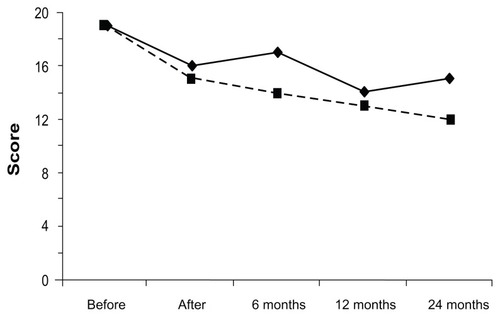
Figure 1 Development of the anxiety (HAD) score (y axis) in participants with a full-time sickness benefit (group 1, thick line, filled squares) and with part-time or no sickness benefit (group 2, hatched line, filled squares, P < 0.0005, Friedman’s one-way analysis of variance) before and after the rehabilitation program and 6, 12, and 24 months after completion (x axis).
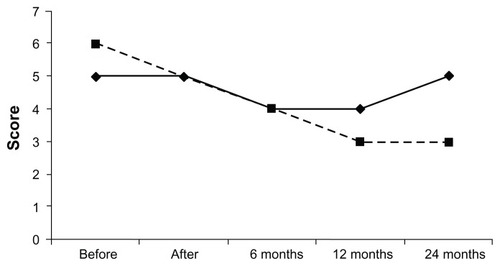
Figure 2 Development of the depression (HAD) score (y axis) in participants with a full-time sickness benefit (group 1, thick line, filled squares) and with a part-time or no sickness benefit (group 2, hatched line, filled squares, P < 0.01, Friedman’s one-way analysis of variance) before and after the rehabilitation program and 6, 12, and 24 months after completion (x axis).
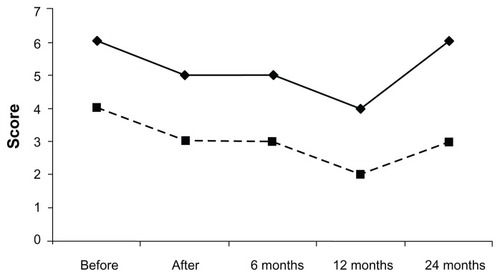
Table 2 Anxiety, depression, and stress scores (medians and percentiles 25–75) in individuals with a full-time sickness benefit (group 1) and with part-time or no sickness benefit (group 2) before rehabilitation and at 2-year follow-up
Figure 3 Development of the stress test score (y axis) in participants with full-time sickness benefit (group 1, thick line, filled squares) and with part-time or no sickness benefit (group 2, hatched line, filled squares, P < 0.0005, Friedman’s one-way analysis of variance) before and after rehabilitation program and at months 6, 12, and 24 after completion (x axis).