Figures & data
Table 1 Age-Specific Incidence Rate (AIR)
Table 2 Morphological Distribution of Cancer
Table 3 Stage Distribution of Cancer
Table 4 Regional Distribution of Age-Standardized Rate (ASR) of Cancer Incidence in Saudis
Table 5 Age-Standardized Rate (ASR) of Cancer Incidence in Saudis and Other Nationalities
Figure 1 Entity relationship diagram (ERD) of CSA. ERD shows the relationship between the tables.
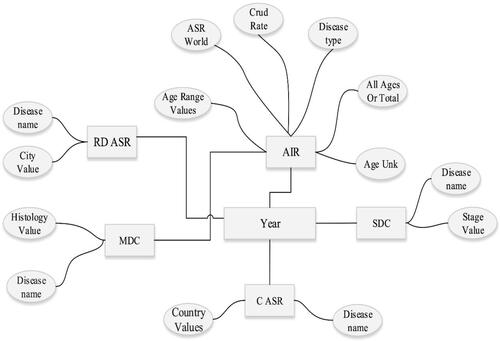
Figure 2 Homepage of the Cancer in Saudi Arabia (CSA).
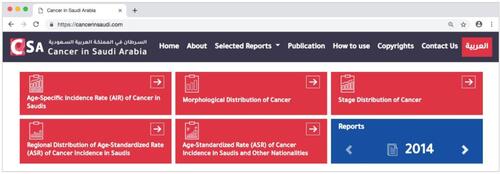
Figure 3 Age specific incidence rate (AIR) of cancer in Saudis per 100,000 population. (A) Comparison of AIR data of all age groups data that were reported in four selected years (only for years were used for simplicity). (B) The AIR data of the top three old age groups from all the 17 years were compared. Asterisk symbol was used to indicate non-available data from SCIRs.
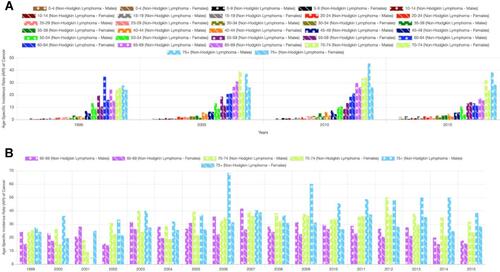
Figure 4 Age standardized rate (ASR) of NHL in Saudis per 100,000 population. (A) The ASR data of all the 13 Saudi regions from seven selected years (only seven years were used for simplicity) were compared using CSA tool. (B) A comparison of the ASR data of six selected regions of Saudi Arabia that were reported in the 17 years.
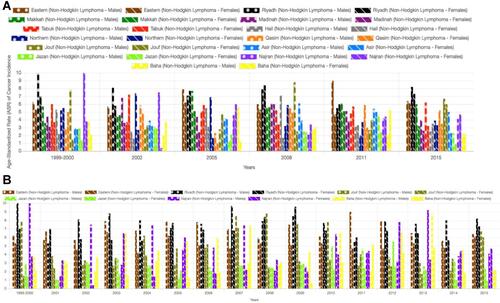
Figure 5 Age standardized rate (ASR) of NHL in Saudis and other nationalities. The ASR of NHL from Saudi Arabia and other Arabic countries along with the US were compared. Asterisk symbol was used to indicate non-available data from SCIRs. Asterisk symbol was used to indicate non-available data from SCIRs.
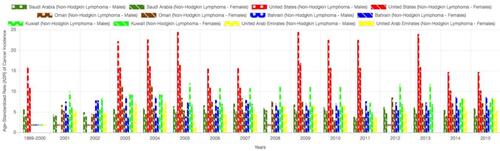
Figure 6 Stage distribution of NHL in Saudi patients. The percentage of stage distribution of NHL that were reported in the 17 years was compared.
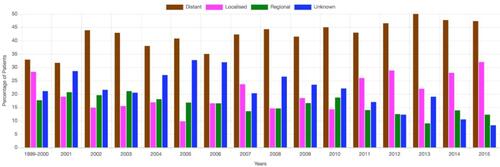
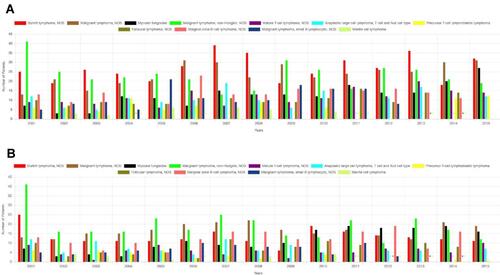
Figure 7 Morphology distribution of NHL in Saudi patients. CSA application was used to compare the number of patients assigned to an NHL morphology that were reported in all the 17 years. Asterisk symbol was used to indicate non-available data from SCIRs.
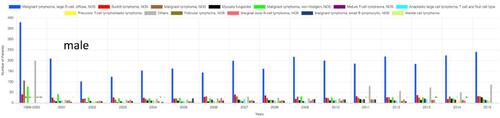
Figure 8 The less frequent morphologies of NHL in Saudi patients. The non-common morphologies of NHL amongst Saudi patients were compared in males (A) and females (B). Asterisk symbol was used to indicate non-available data from SCIRs.