
Figures & data
Table 1 Sociodemographic Status of the Participants
Figure 1 Distribution of health status among hospitalized patients with NCDs.
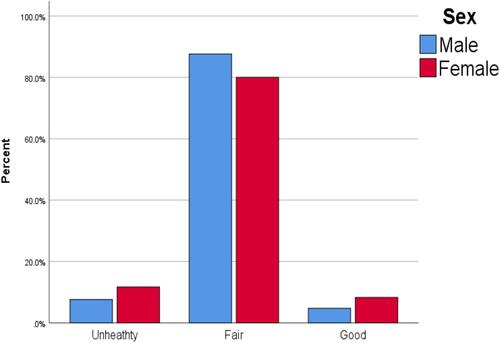
Figure 2 Distribution of underlying diseases among hospitalized patients with NCDs.
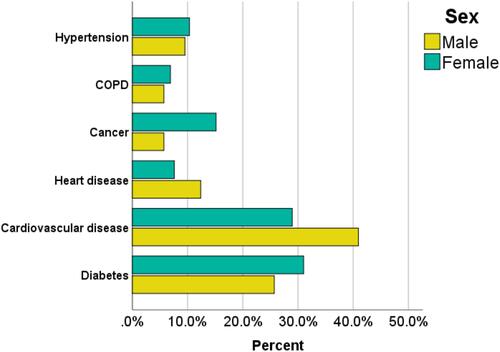
Table 2 Mean, Standard Deviation, and Level of Health-Promoting Behaviors
Table 3 Correlation Matrix of Health-Promoting Behaviors
Table 4 Regression of Individual Health-Promoting Behaviors