Figures & data
Figure 1 Illustration schematic of the image acquisition setup.
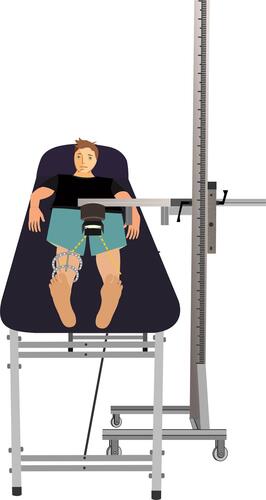
Figure 2 Photograph of the evaluated limb (right leg) (A); Infrared image and defined ROIs (B). ROI1 –proximal tibia. ROI2 – tibia shaft (diaphyseal), ROI3 – distal tibia.
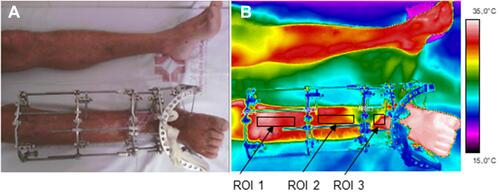
Figure 3 Clinical follow-ups 1 (A and B), 2 (C and D) and 3 (E and F); (A, C, E) infrared images and (B, D, F) X-ray.
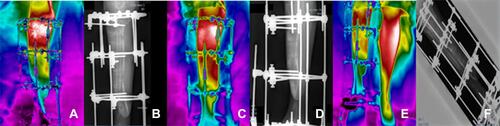
Figure 4 Clinical follow-ups 4 (A and B), 5 (C and D) and 6 (E and F); (A, C, E) infrared images and (B, D, F) X-ray.
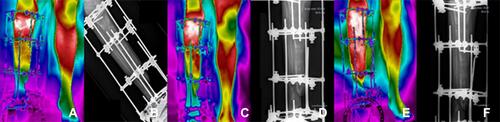
Figure 5 Clinical follow-ups 7 (A and B), 8 (C and D) and 9 (F), (A, C, F) infrared image and (B and D) X-ray.
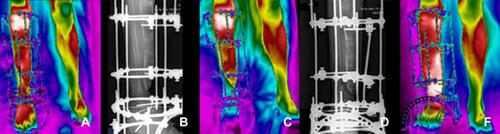
Figure 6 Clinical follow-ups 12 (A and B), 14 (C and D) and 16 (E and F), (A, C, E) infrared image and (B, D, F) X-ray.
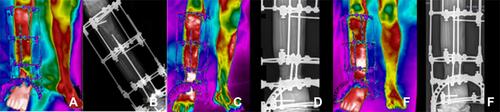
Figure 7 Clinical follow-ups 17 (A and B), 19 (C and D) and 20 (E), (A, C, E) infrared image and (B, D) X-ray.
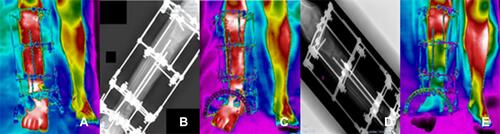
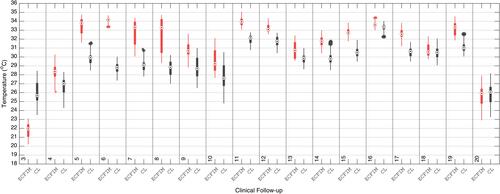
Figure 8 Evolution of median temperature in the ROIs of the right leg (under treatment) in the 20 clinical follow-ups. The error bars correspond to one standard deviation.
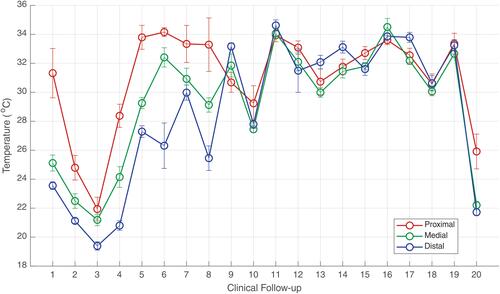
Figure 9 Evolution of median temperature in the ROIs of the right leg (under treatment) in the 20 clinical segments using the ECFIM in comparison with the ROIs of the healthy left leg (CL). The error bars correspond to one standard deviation.
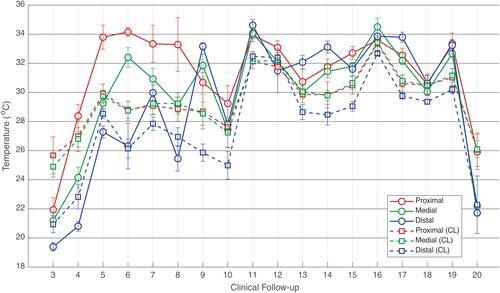
Figure 10 Boxplot of the median temperature of the ROI of the right proximal tibia with the use of the ECFIM, in the 20 follow-up sessions, compared with the ROI of the same portion of the healthy left leg (CL).
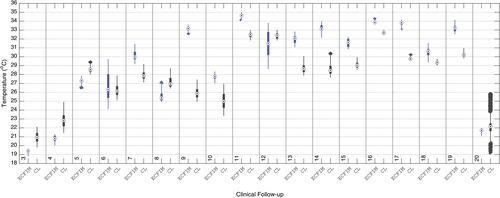
Figure 11 Boxplot of the median temperature of the ROI of the diaphysis portion of the right tibia using the ECFIM, in the 20 follow-up sessions, compared with the healthy left leg (CL).
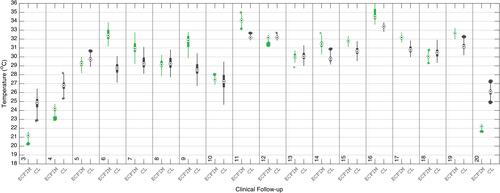
Figure 12 Boxplot of the median temperature of the ROI of the right distal tibia portion (with ECFIM), in the following 20 clinicians, with the ROI of the same portion of the healthy left leg.