Figures & data
Table 1 Demographics, Anthropometric, Pulmonary Function Test, Maximal Respiratory Pressures and Physical Activity Components of GPAQ
Table 2 Correlation Coefficient (r) of MIP, MEP and MVV with Demographics, Anthropometric Measures, Pulmonary Function Test Measures and Global Physical Activity Questionnaire (GPAQ) Components
Table 3 Association of MIP, MEP and PFT Values (FVC, FEV1 and MVV) with Age, Gender and BMI Using Regression Analysis
Figure 1 Scatter diagram of FVC with age, gender and BMI (R2- coefficient of determination).
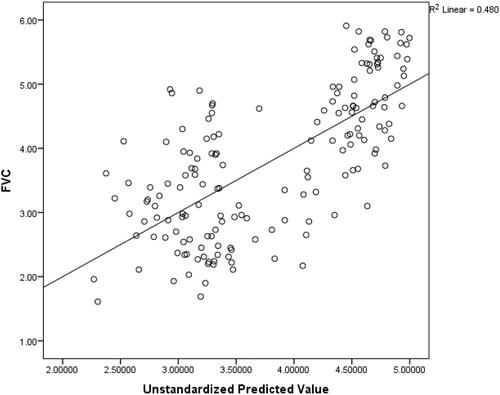
Figure 2 Scatter diagram of FEV1 with age, gender and BMI (R2- coefficient of determination).
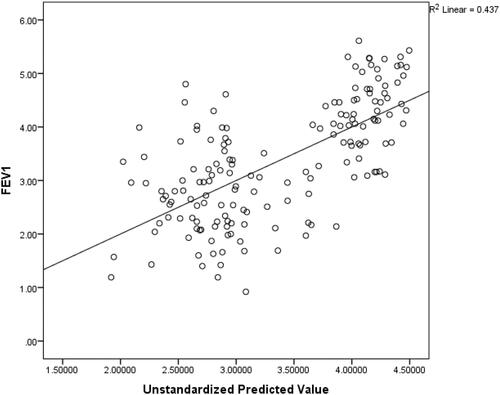
Figure 3 Scatter diagram of MVV with age, gender and BMI (R2- coefficient of determination).
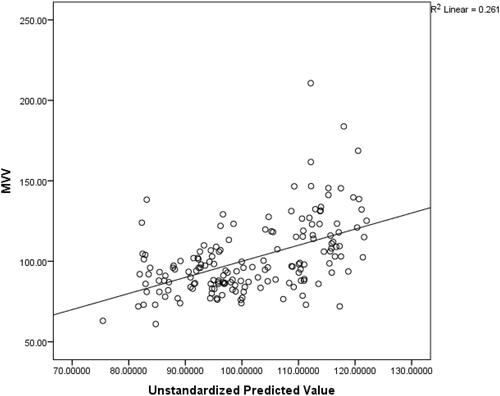
Figure 4 Scatter diagram of MIP with age, gender and BMI (R2- coefficient of determination).
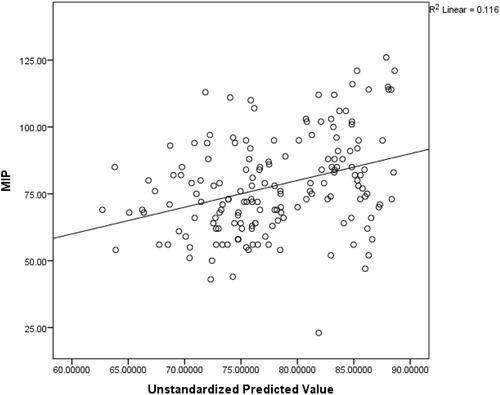
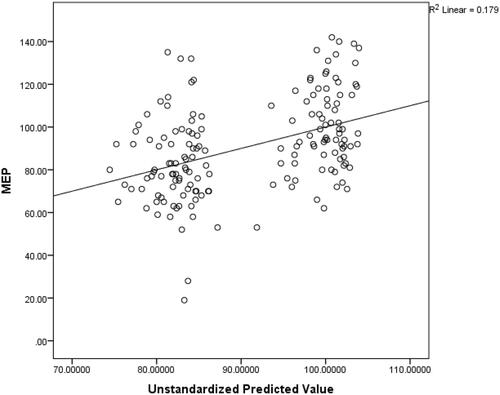
Figure 5 Scatter diagram of MEP with age, gender and BMI (R2- coefficient of determination).