Figures & data
Table 1 Baseline descriptive characteristics of 30 patients admitted to the vascular unit with lower limb ulcers between August and November 2007
Figure 1 Survival curve for number of days to first readmission according to BMI.
Notes: Survival curve for number of days to first readmission according to BMI for 30 patients admitted to the vascular unit with lower limb ulcers between August and November 2007 and followed up for 3 years. P = 0.542 according to Kaplan–Meier log rank test.
Abbreviation: BMI, body mass index.
Abbreviation: BMI, body mass index.
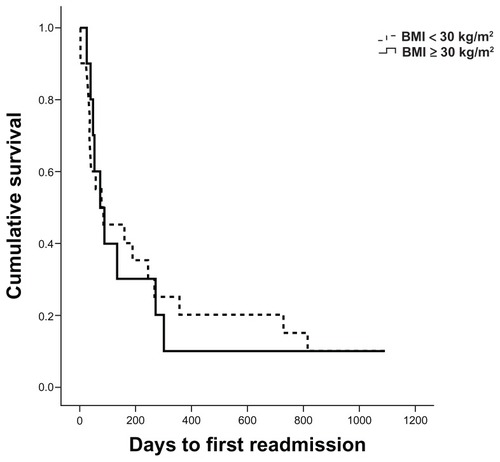
Table 2 Outcome data for 30 patients admitted to the vascular unit with lower limb ulcers between August and November 2007
Figure 2 Survival curve for number of days to death according to BMI.
Notes: Survival curve for number of days to death according to BMI for 30 patients admitted to the vascular unit with lower limb ulcers between August and November 2007 and followed up for three years. P = 0.027 according to Kaplan–Meier log rank test.
Abbreviation: BMI, body mass index.
Abbreviation: BMI, body mass index.
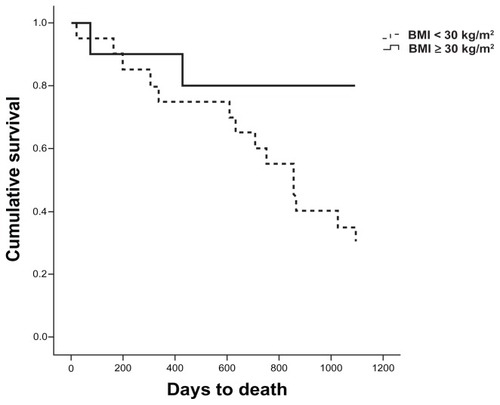
Table 3 Outcome data at 3 years for 30 patients admitted to the vascular unit with lower limb ulcers between August and November 2007 according to fat (kg, %) and fat-free mass (kg, %) as measured by bioelectrical impedance analysis