Figures & data
Table 1 Trauma team activation criteria at St Olav’s University Hospital
Figure 1 Pre- and in-hospital trauma care process model including definition of time intervals.
Abbreviations: ED, emergency department; LOS, length of stay; TTN, trauma team notification; TTA, trauma team activation; CXR, chest X-ray; ECC, emergency call center.
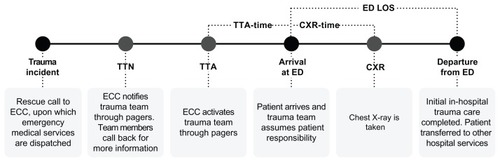
Table 2 Descriptive statistics from trauma team activations in 2009
Figure 2 Box plots of CXR-times (minutes) for groups of differently timed TTA (minutes).
Notes: *More than three box lengths from the box; °between 1.5–3 box lengths from the box.
Abbreviations: CXR, chest X-ray; TTA, trauma team activation.
Abbreviations: CXR, chest X-ray; TTA, trauma team activation.
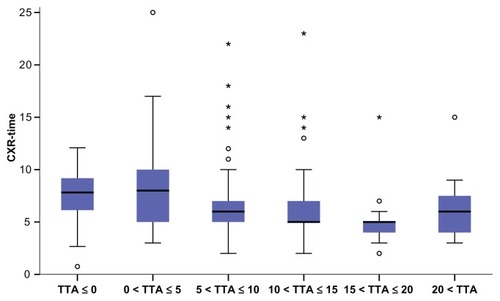
Table 3 The effect of trauma team notification
Table 4 The effect of differently timed trauma team activations on CXR-time and ED LOS
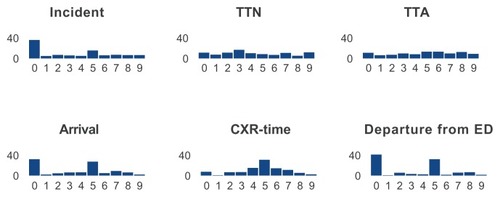
Figure 3 Distribution (%) of last digits in recorded time data.
Notes: Incident, arrival, CXR-time, and departure from ED were recorded manually. TTN and TTA were recorded automatically.
Abbreviations: ED, emergency department; TTN, trauma team notification; TTA, trauma team activation; CXR, chest X-ray.
Abbreviations: ED, emergency department; TTN, trauma team notification; TTA, trauma team activation; CXR, chest X-ray.