
Figures & data
Table 1 Analysis of Demographic Characteristics
Table 2 Descriptive Statistical Analysis of Semen Quality Indexes
Figure 1 Pearson’s correlation coefficient was performed to analyze the correlations of semen quality indicators using the correlation function in the Performance Analytics package of the R language (**P<0.01, ***P<0.001).
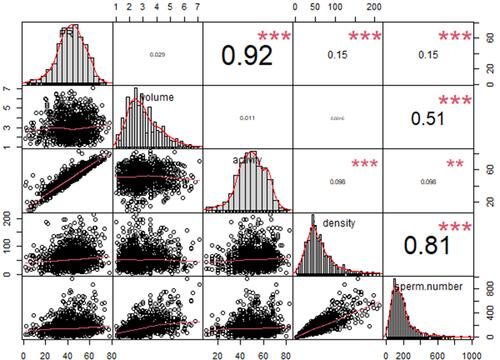
Figure 2 The factor load diagram was obtained using the principal function in the psych package of the R language.
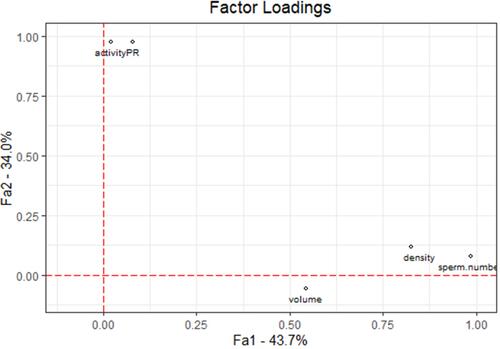
Table 3 Descriptive Statistical Analysis of Influencing Factors and Variables