Figures & data

Figure 1 The classification of countries into seven world regions which formed the basis for this narrative review. Countries/territories in white color were not screened in the review. The map was generated in Microsoft Excel, powered by Bing, © GeoNames, Microsoft, Navinfo, TomTom, Wikipedia. We are neutral with regard to jurisdictional claims in this map.
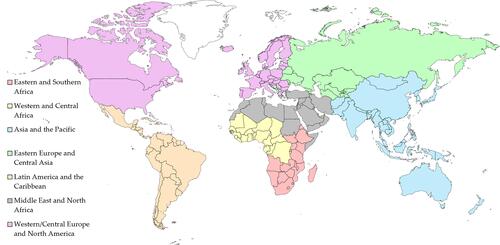
Figure 2 COVID-19 vaccine acceptance rates in countries from Eastern and Southern Africa. The included countries were numbered, with COVID-19 vaccine acceptance rates shown besides the dates of surveys. The map was generated in Microsoft Excel, powered by Bing, © GeoNames, Microsoft, Navinfo, TomTom, Wikipedia. We are neutral with regard to jurisdictional claims in this map.
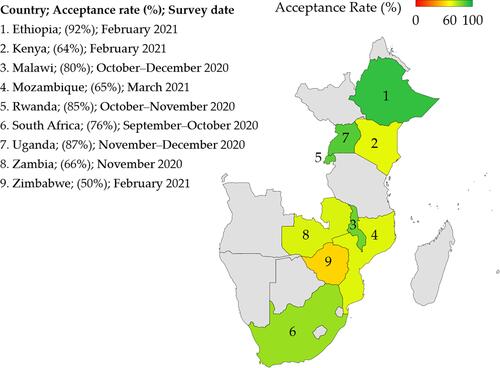
Figure 3 COVID-19 vaccine acceptance rates in countries from Western and Central Africa. The included countries were numbered, with COVID-19 vaccine acceptance rates shown besides the dates of surveys; DRC: Democratic Republic Of The Congo. The map was generated in Microsoft Excel, powered by Bing, © GeoNames, Microsoft, Navinfo, TomTom, Wikipedia. We are neutral with regard to jurisdictional claims in this map.
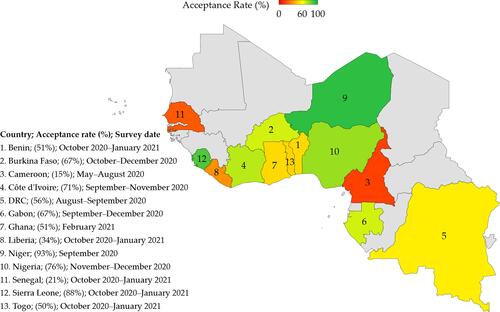
Figure 4 COVID-19 vaccine acceptance rates in countries/territories from Asia and the Pacific. The included countries/territories were numbered, with COVID-19 vaccine acceptance rates shown besides the dates of surveys. The map was generated in Microsoft Excel, powered by Bing, © GeoNames, Microsoft, Navinfo, TomTom, Wikipedia. We are neutral with regard to jurisdictional claims in this map.
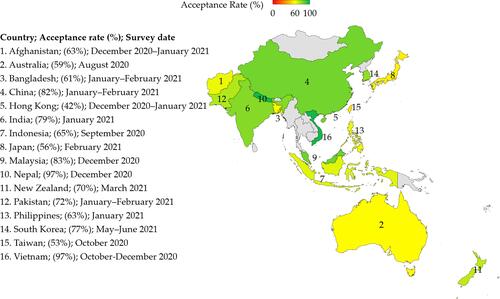
Figure 5 COVID-19 vaccine acceptance rates in countries/territories from Eastern Europe and Central Asia. The included countries/territories were numbered, with COVID-19 vaccine acceptance rates shown besides the dates of surveys. The map was generated in Microsoft Excel, powered by Bing, © GeoNames, Microsoft, Navinfo, TomTom, Wikipedia. We are neutral with regard to jurisdictional claims in this map.
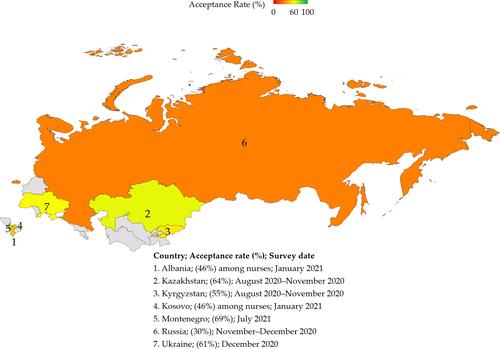
Figure 6 COVID-19 vaccine acceptance rates in countries/territories from Latin America and the Caribbean. All data were collected from the study by Urrunaga-Pastor et al.Citation92 The included countries/territories were numbered, with COVID-19 vaccine acceptance rates. All surveys were conducted during January–February 2021. The map was generated in Microsoft Excel, powered by Bing, © GeoNames, Microsoft, Navinfo, TomTom, Wikipedia. We are neutral with regard to jurisdictional claims in this map.
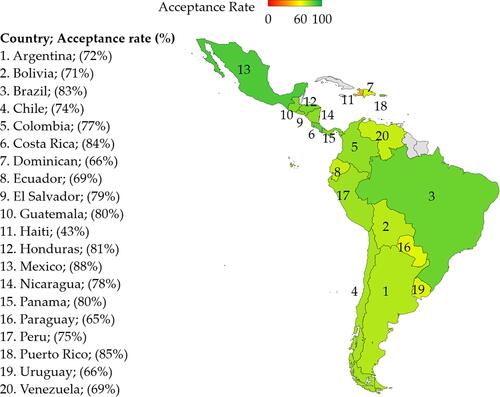
Figure 7 COVID-19 vaccine acceptance rates in countries/territories from the Middle East and North Africa. The included countries/territories were numbered, with COVID-19 vaccine acceptance rates shown besides the dates of surveys; HCWs: Healthcare workers; UAE: United Arab Emirates. The map was generated in Microsoft Excel, powered by Bing, © GeoNames, Microsoft, Navinfo, TomTom, Wikipedia. We are neutral with regard to jurisdictional claims in this map.
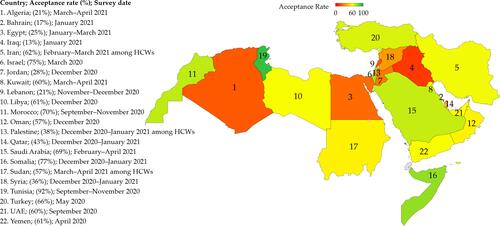
Figure 8 COVID-19 vaccine acceptance rates in North America. The map was generated in Microsoft Excel, powered by Bing, © GeoNames, Microsoft, Navinfo, TomTom, Wikipedia. We are neutral with regard to jurisdictional claims in this map.
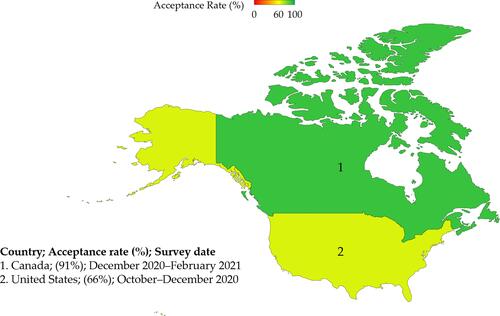
Figure 9 COVID-19 vaccine acceptance rates in countries from Central and Western Europe. The included countries were numbered, with COVID-19 vaccine acceptance rates shown besides the dates of surveys; HCWs: Healthcare workers; UK: United Kingdom. The map was generated in Microsoft Excel, powered by Bing, © GeoNames, Microsoft, Navinfo, TomTom, Wikipedia. We are neutral with regard to jurisdictional claims in this map.
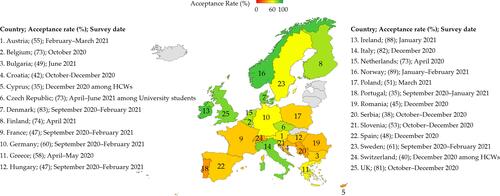
Figure 10 The global rates of COVID-19 vaccine acceptance. The map was generated in Microsoft Excel, powered by Bing, © GeoNames, Microsoft, Navinfo, TomTom, Wikipedia. We are neutral with regard to jurisdictional claims in this map.
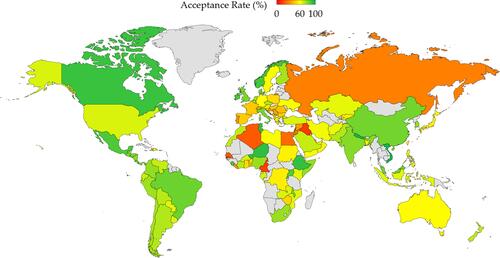
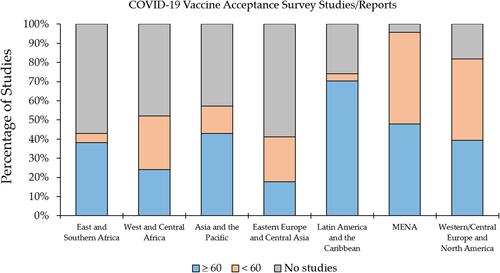
Figure 11 The percentage of studies on COVID-19 vaccine acceptance among different countries in different world region.