
Figures & data
Table 1 Demographic Characteristics of Study Sample
Figure 1 Sociodemographic information (A: percentage of participants based on their gender, B: percentage of participants based on their place of work, C: percentage of participants based on their academic qualifications, D: percentage of participants based on their occupation/position).
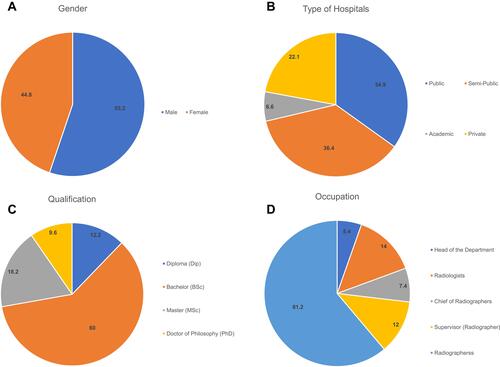
Table 2 Radiology Personnel’s Level of Agreement Concerning
Table 3 Comparison of All Domains According to the Sociodemographic Variables
Table 4 Correlation Matrix Between Domains