
Figures & data
Table 1 Radiologists’ Responses to the Survey Evaluating Practices in Pediatric CT
Figure 1 The experience levels of the participants in the survey, including those in radiology years R1–R4, radiologists, and consultants.
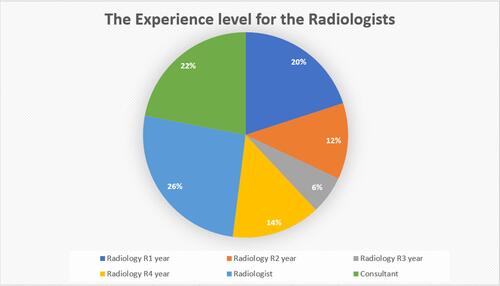
Table 2 Technologists’ Responses to the Survey Evaluating Practices in Pediatric CT
Figure 2 The experience levels of the technologists who participated in the survey, including those in their internship year and those with less than 1 year to more than 10 years of experience.
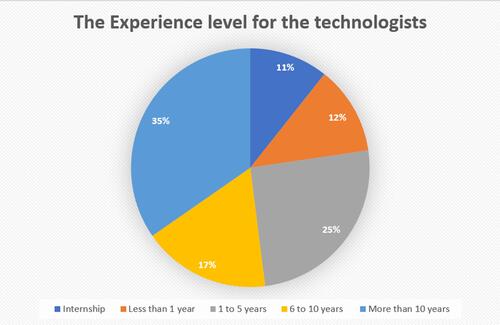
Table 3 A Comparison Between the Radiologists’ Responses to the Survey Evaluating Practices in Pediatric Imaging Modalities