Figures & data
Figure 1 Schematic of survey content. The case directed to participating critical care specialists began with the second presentation. In contrast, rheumatologists were presented with only the initial patient presentation and subsequent laboratory findings. Where indicated, unique laboratory values and/or clinical parameters were incorporated into the cases presented to participating rheumatologists and critical care specialists.
Table 1 Demographic characteristics of survey participants
Figure 2 Recommendations for laboratory tests and hematology consultation across surveyed specialties: first and second presentations. The percentages of physicians in each specialty who would have ordered specific hematologic laboratory tests after each of the case patient’s presentations (A and C) and the percentages who would have ordered repeat coagulation studies and consulted a hematologist after reviewing each set of laboratory results (B and D) are shown. Critical care specialists began their case presentation with the second presentation and were given a different set of vital signs from the other specialties (see ). Rheumatologists were presented with only the initial patient presentation and subsequent laboratory findings, which included PT and aPTT values that were different from those provided to the other specialties (see ). In addition, the case patient presented to rheumatologists was evaluated and managed on an outpatient basis. Hematologists were not queried about consulting a hematologist in response to hematologic laboratory results.
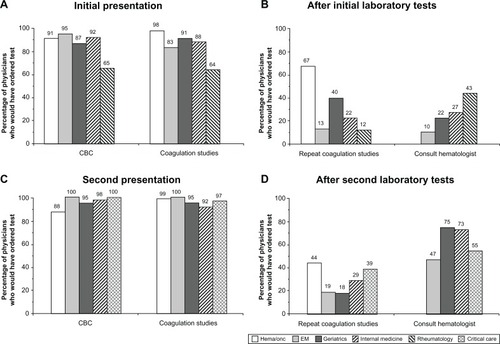
Figure 3 Additional tests and consultations recommended after second clinical presentation.
Abbreviations: CT, computerized tomography; EM, emergency medicine; gI, gastroenterology; UgI, upper gastrointestinal.
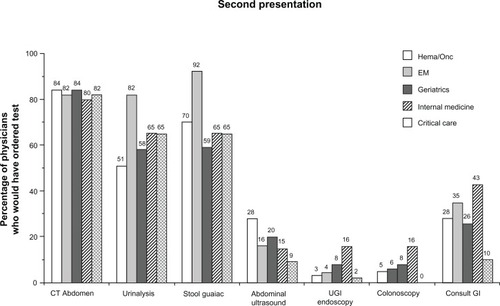
Figure 4 Recommendations for repeat coagulation studies and hematology consultation in response to laboratory results after 12 hours of observation subsequent to the case patient’s second presentation.
Abbreviations: EM, emergency medicine; heme/onc, hematology/oncology.
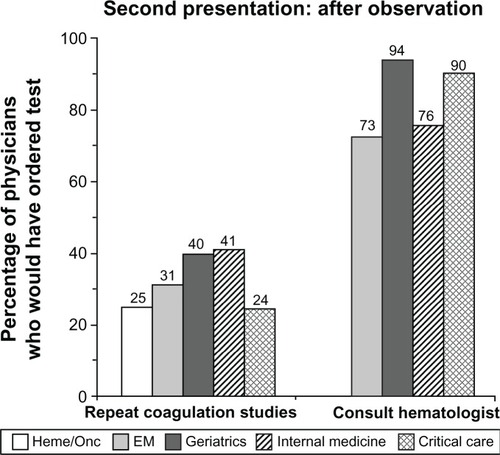
Figure 5 Recommended disposition after initial and second presentations and after 12 hours of observation. (A) The proportion of physicians in each surveyed specialty who would have recommended overnight admission to the general hospital floor or discharge to a skilled nursing care facility/nursing home after the case patient’s first presentation and subsequent laboratory results are shown. (B) The percentage of physicians in each specialty recommending admission to the general hospital floor versus the ICU after the patient’s initial laboratory results upon second admission and subsequent results obtained after 12 hours of observation are shown. See for the summarized laboratory findings.
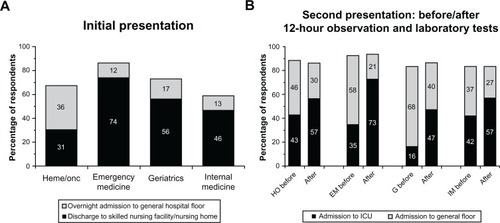
Figure 6 Prior physician experience with bleeding disorders. Results represent (A) the percentage of physicians in each specialty that had ever discovered (or diagnosed, in the case of the hematologists and hematologist/oncologists) an underlying bleeding disorder and (B) the percentages of those physicians who had specifically encountered “acquired hemophilia.”
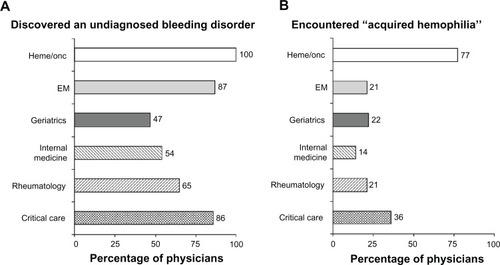
Table 2 Utilization of and rationale for hematology consultation