
Figures & data
Figure 1 PRISMA flow chart of the study selection process. PRISMA flow chart, visualizing the process of inclusion and exclusion of studies divided into four steps: identification of studies, screening of studies, eligibility assessment, and included studies.
Notes: Adapted from: Tricco AC, Lillie E, Zarin W, et al. PRISMA extension for scoping reviews (PRISMA-ScR): checklist and explanation. Annals of internal medicine. 2018;169(7):467–473.Citation24 Creative Commons.
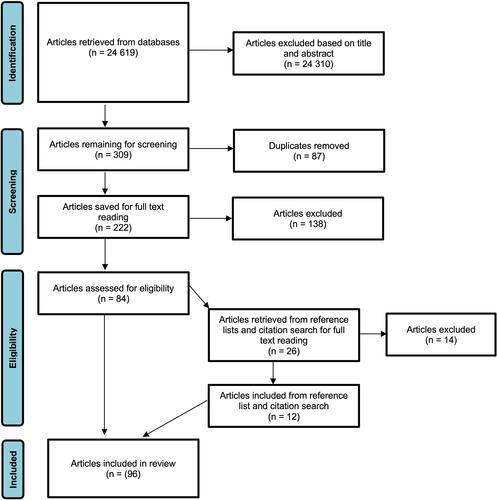
Table 1 Descriptive Findings from the Included Articles – Top 3
Table 2 Distribution of Charted Categories Among Included Articles with Examples of Key Results