Figures & data
Table 1 Demographic Data and Characteristics of All Respondents (N= 5008)
Table 2 Association of Demographic Variables with the Awareness and Utilization of the Seha App (n=5008)
Table 3 The Frequency and Percentage of Utilization of the Seha App Services (N= 988)
Table 4 Satisfaction with Seha App (N= 988)
Figure 1 Percentage of users per app(s) affiliated with the ministry of health (n =4464).
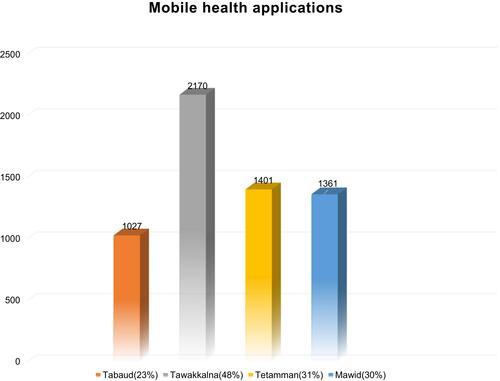
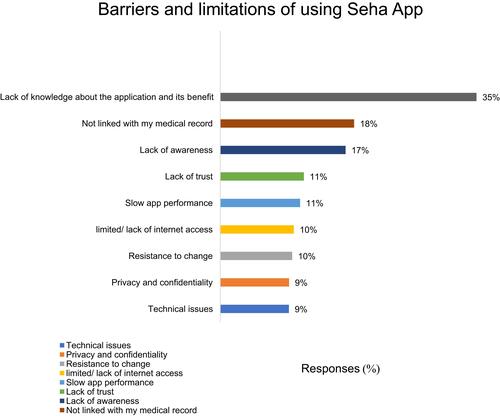
Figure 2 The most common barriers or limitations of using the Seha app (n =4501).