
Figures & data
Table 1 Demographic and Descriptive Data for the 150 Participants
Table 2 Education/Training the Participants Had Received and Assessments Undertaken Regarding Lifestyle Behaviors and Risk Factors
Figure 1 Participants’ (n = 118) level of confidence level at assessing lifestyle behaviors and risk factors.
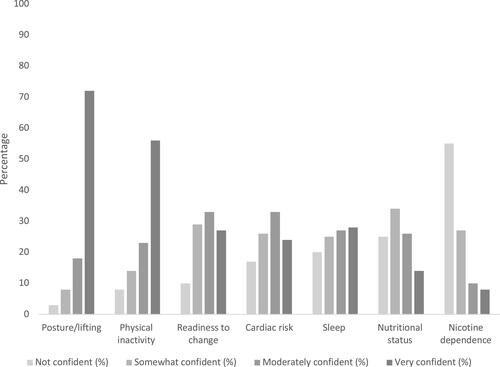
Figure 2 Participants’ (n = 98) frequency of advising patients about lifestyle behaviors and risk factors.
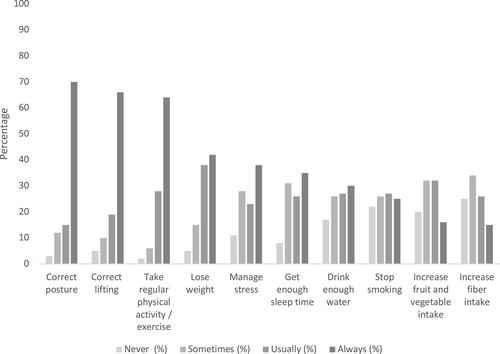
Figure 3 Participants’ (n = 85) perception of priority of addressing lifestyle behaviors and risk factors.
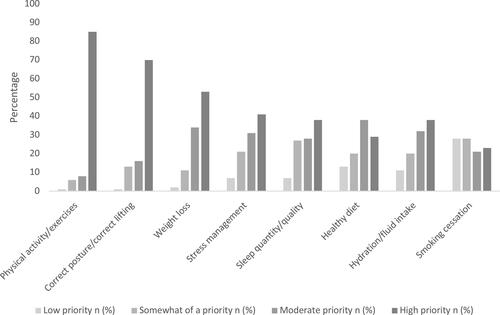
Figure 4 Rating of the significance of potential barriers to providing health and wellness promotion (n=78).
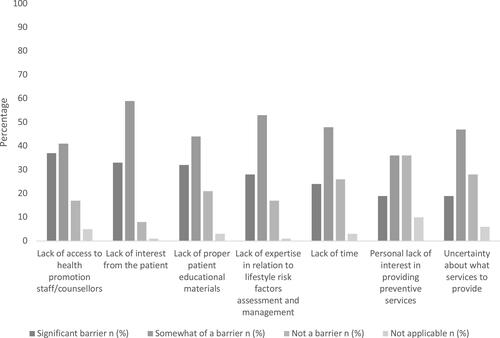
Table 3 Simple Logistic Regressions for the Effect of Age, Gender, and Experience on the Likelihood That Participants Assess Smoking, Diet, Sleep, Stress/Psychological Status, and Physical Activity/Exercise