Figures & data
Figure 1 Flow diagram of literature search for including studies in meta-analysis.
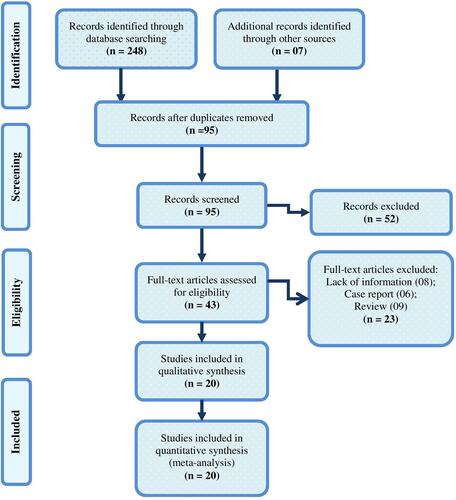
Table 1 Basic Characteristics of Included Studies in the Meta-Analysis and Estimating Prevalence of Several Symptoms Related to Novel Coronavirus (COVID-19) Patients
Figure 2 Meta-Analysis of symptoms of COVID-19. A–E represent the prevalence of fever, cough, fatigue, dyspnoea and myalgia, respectively.
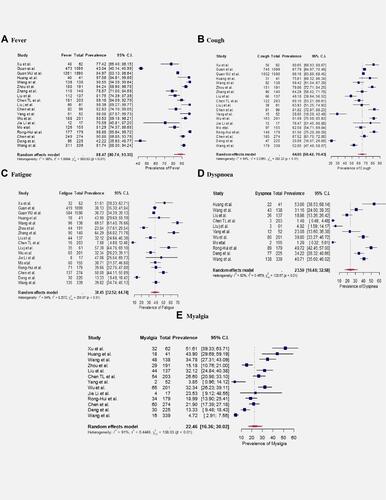
Figure 3 Meta-Analysis representing severity of symptoms in COVID-19 patients. A–E represent Mantel-Haenszel (MH) odds ratio of fever, cough, fatigue, dyspnoea and myalgia, respectively.
Notes: In all figures, “Experimental Events” represents the no. of severe patients having corresponding symptom; “Control Events” represents all the severe patients reporting in the particular study.
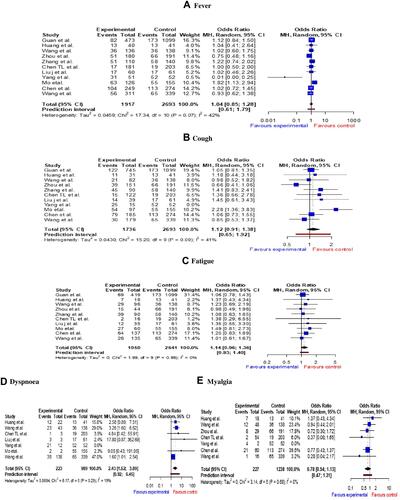
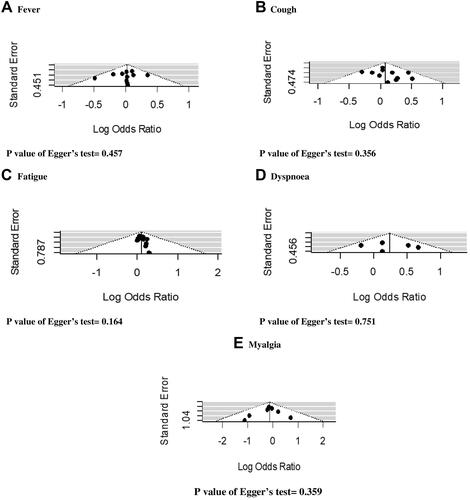
Figure 4 Funnel plot with Egger’s test for assessing publication bias. (A) Fever; (B) cough; (C) fatigue; (D) dyspnoea; (E) myalgia.