Figures & data
Figure 1 The intervention outcome mapping in the lens of the theory of change.
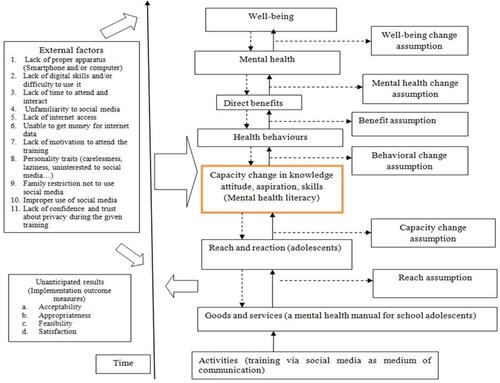
Figure 2 Flow chart of the study design.
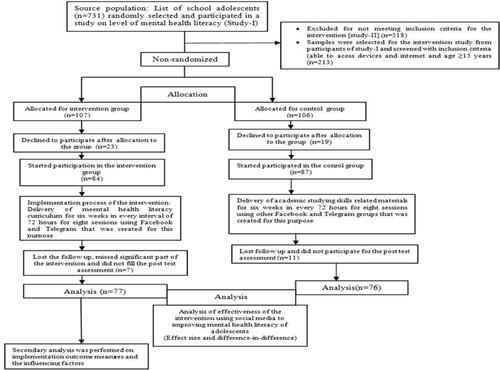
Figure 3 Conceptual framework, regression model, and coefficients for the estimation of the difference-in-differences.
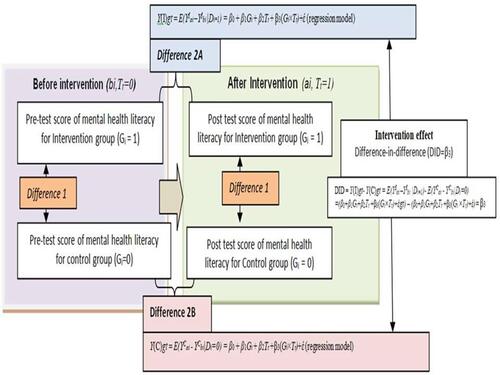
Table 1 Summary of Demographic Characteristics for Intervention and Control Groups
Figure 4 The pre-test and post-test scores of mental health literacy for both intervention and control groups.
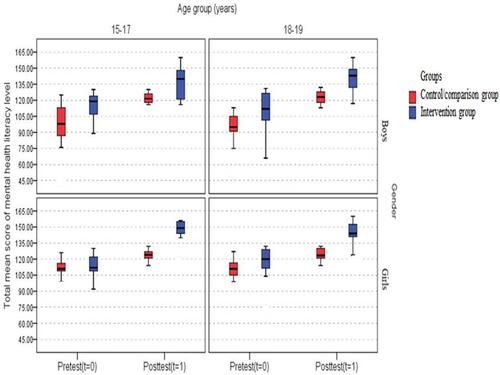
Table 2 Effect Size for Chang of Total Mental Health Literacy Score in Intervention and Control Groups by Age and Sex
Table 3 Difference-in-Differences (DID) Estimating the Effect of the Intervention on the Mean Score of Mental Health Literacy
Figure 5 Difference-in-differences showing the effect of the intervention on the mental health literacy score. (A) All participants; (B) Boys (15–17 years); (C) Boys (18–19 years); (D) Girls (15–17 years) and (E) Girls (18–19 years).
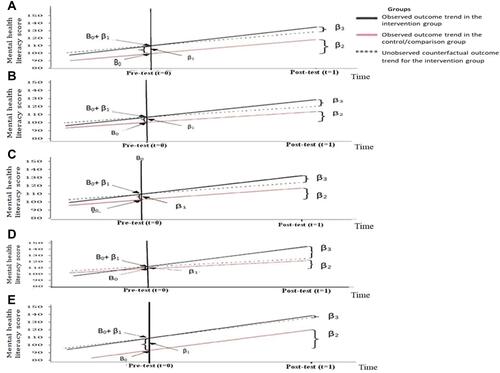
Table 4 Differences in Perceived Intervention Implementation Outcome Measures by Gender, Age Group, and School Grade
Figure 6 Percentage of intervention group participants’ rating on the intervention implementation outcome measures.
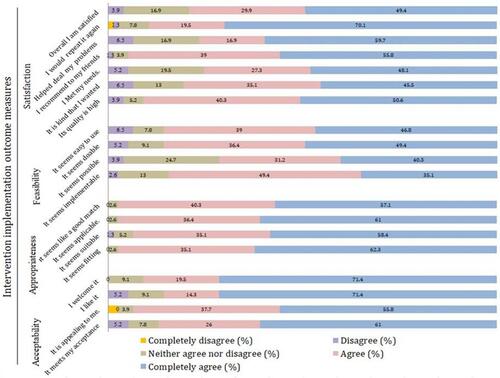
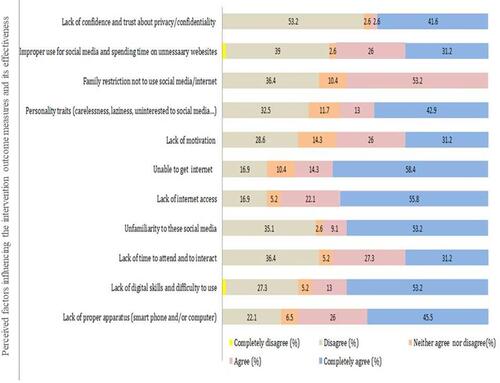
Figure 7 Self-ratings of agreement with factors supposedly influencing the intervention implementation outcomes.