
Figures & data
Figure 1 ArcMap of the study area with respect to regions of Ethiopia.
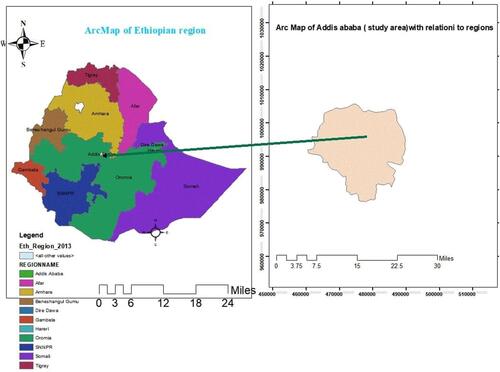
Table 1 Socio-Demographic and Neonatal Characteristics of Neonates with Esophageal Atresia Admitted to TikurAnbesa Specialized Hospital, Addis Ababa, Ethiopia; from March 2011 to February 2021 (n = 225)
Table 2 Maternal Related Characteristics of Neonates Diagnosed with Esophageal Atresia Admitted to TikurAnbesa Specialized Hospital, Addis Ababa, Ethiopia; from March 2011 to February 2021 (n = 225)
Figure 2 Kaplan–Meier failure curve of neonates with esophageal atresia admitted in NICU at TikurAnbesa specialized Hospital from March 2011 to February 2021(n = 225).
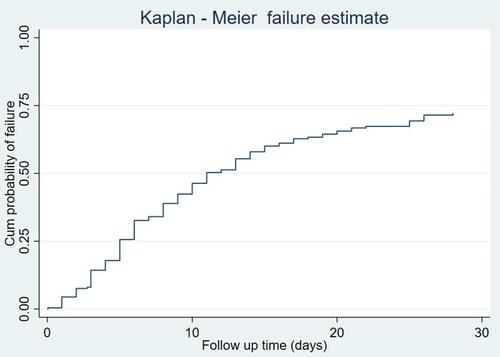
Figure 3 Kaplan–Meier failure curve by birth weight, dehydration, and malnutrition of neonates with esophageal atresia admitted in NICU at TikurAnbesa specialized Hospital from March 2011 to February 2021(n = 225).
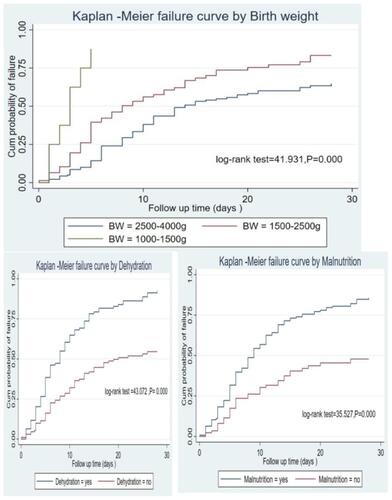
Table 3 Bivariable and Multivariable Cox Regression Model for Predictors of Time to Death Among Neonates with Esophageal Atresia Admitted in NICU at TikurAnbesa Specialized Hospital from March 2011 to February 2021 (n = 225)