Figures & data
Table 1 Demographic Characteristics of the Study Sample (N= 4853)
Table 2 Obstetric Data of the Sample (N= 4853)
Table 3 Breakdown of the Specific Types of Hormonal and Non-Hormonal Contraception Methods Used (N= 4853)
Figure 1 Types of contraception.
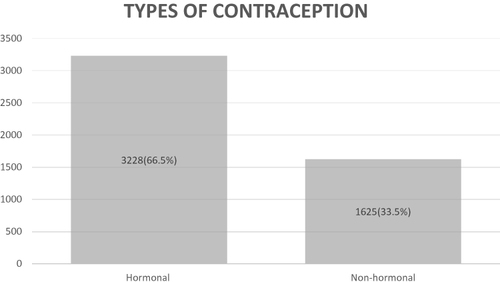
Table 4 Comparative Study Between Hormonal and Non-Hormonal Contraception in Relation to Different Demographic Factors and Obstetric History [N (%)]
Table 5 The Association Between Depression and Duration of Contraceptive Use
Figure 2 Depression provenance.
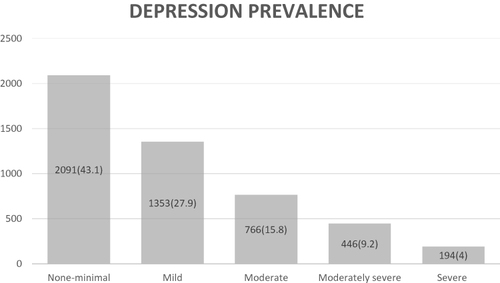
Table 6 The Association Between Depression and Contraception Methods [N (%)]
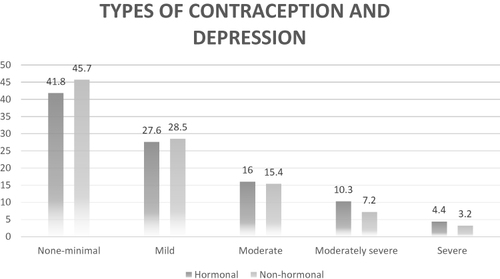
Figure 3 Types of contraception and depression.